Complex quizzing report
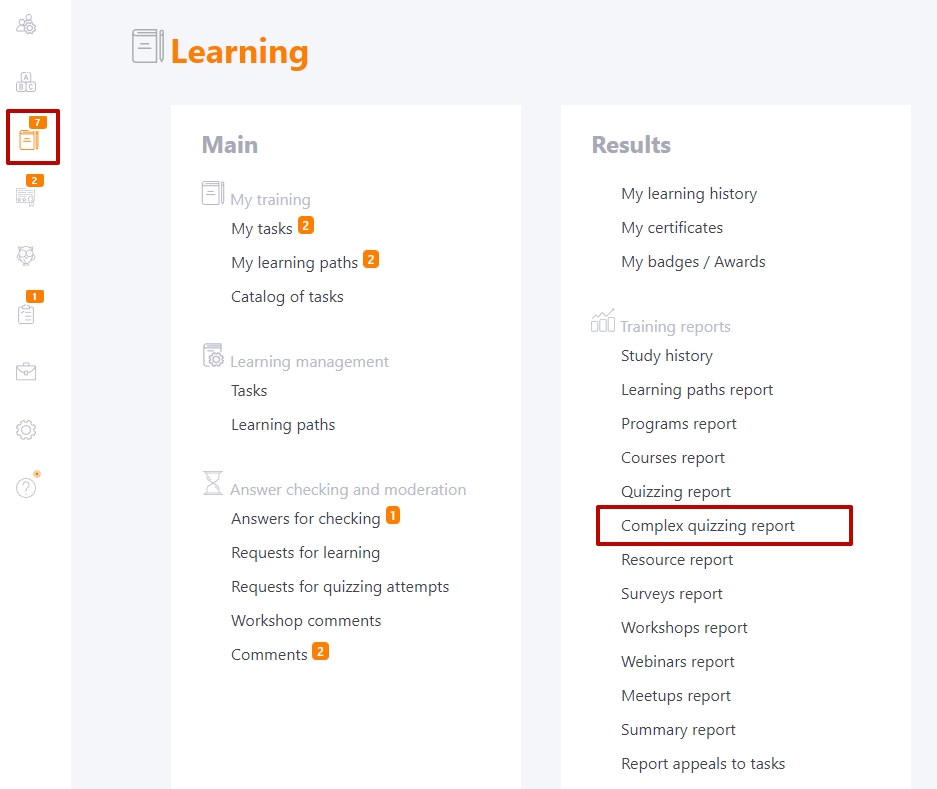
To view Complex quizzing reports, enter the Learning - Complex quizzing report menu:
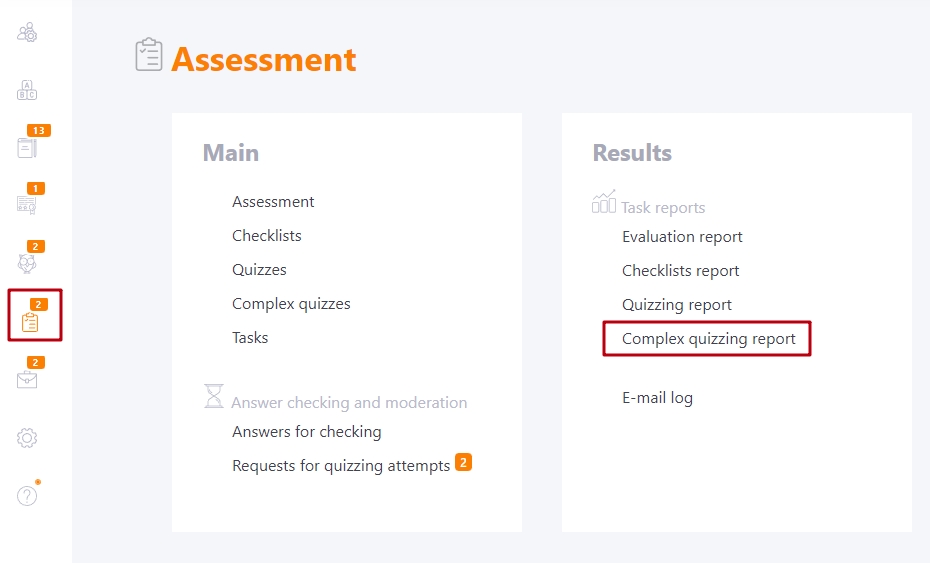
Or the Assessment - Task reports -Complex quizzing report menu:
Complex quizzes can be used as separate tasks or be part of the Program structure.
Filters are used to select the desired task:
- (1) - filter to select programs that include complex quizzes. Only programs that use quizzes as part of them are displayed. The default setting is "Out of programs".
- (2) - filter to select a complex quiz to search for tasks by names of complex quizzes;
- (3) - filter for selecting task titles. Along with the task title, the creation date and Id number are displayed.
The Success overview graph and the Number of request to complex quiz graph visually show information about completing the complex quiz.
The Success overview graph is built with respect to the status of quiz completion by users.
- Successful - the percentage of all users who successfully completed the quiz. The status of task completion in such users "Completed"
- Failure - the percentage of all users who failed the quiz. Task completion status - Failed
- Out of studying - percent of all other users, with quiz statuses: Not started, Started, In progress, Checking is awaited.
Number of request to complex quiz - the graph shows how and when users were quizzed. The graph is built from the first access to the quiz. To get information for another period, you need to set filters in the table with users. The graph reacts to all changes in the filters. The graph displays two types of data:
-
Number of requests - bar graphs that show the number of times the quiz was opened (must match the data in the "Task Accesses Report")
- User number - a linear graph, indicating the number of users that took the quiz relative to the dates.
The table with the users assigned to the task is displayed next. Here you can see the main information about the users (avatar, full name, position, city, department, tags, completion date) and the results of the task (status, result, number of attempts, individual results for the topics from the comprehensive quiz, the link "More" with the ability to go to the general protocol of the complex quiz).
(4) - unlike regular quizzing, you can view the quiz results for each topic in the Complex quiz report. For each topic the transition to the Quizzing protocol is available.
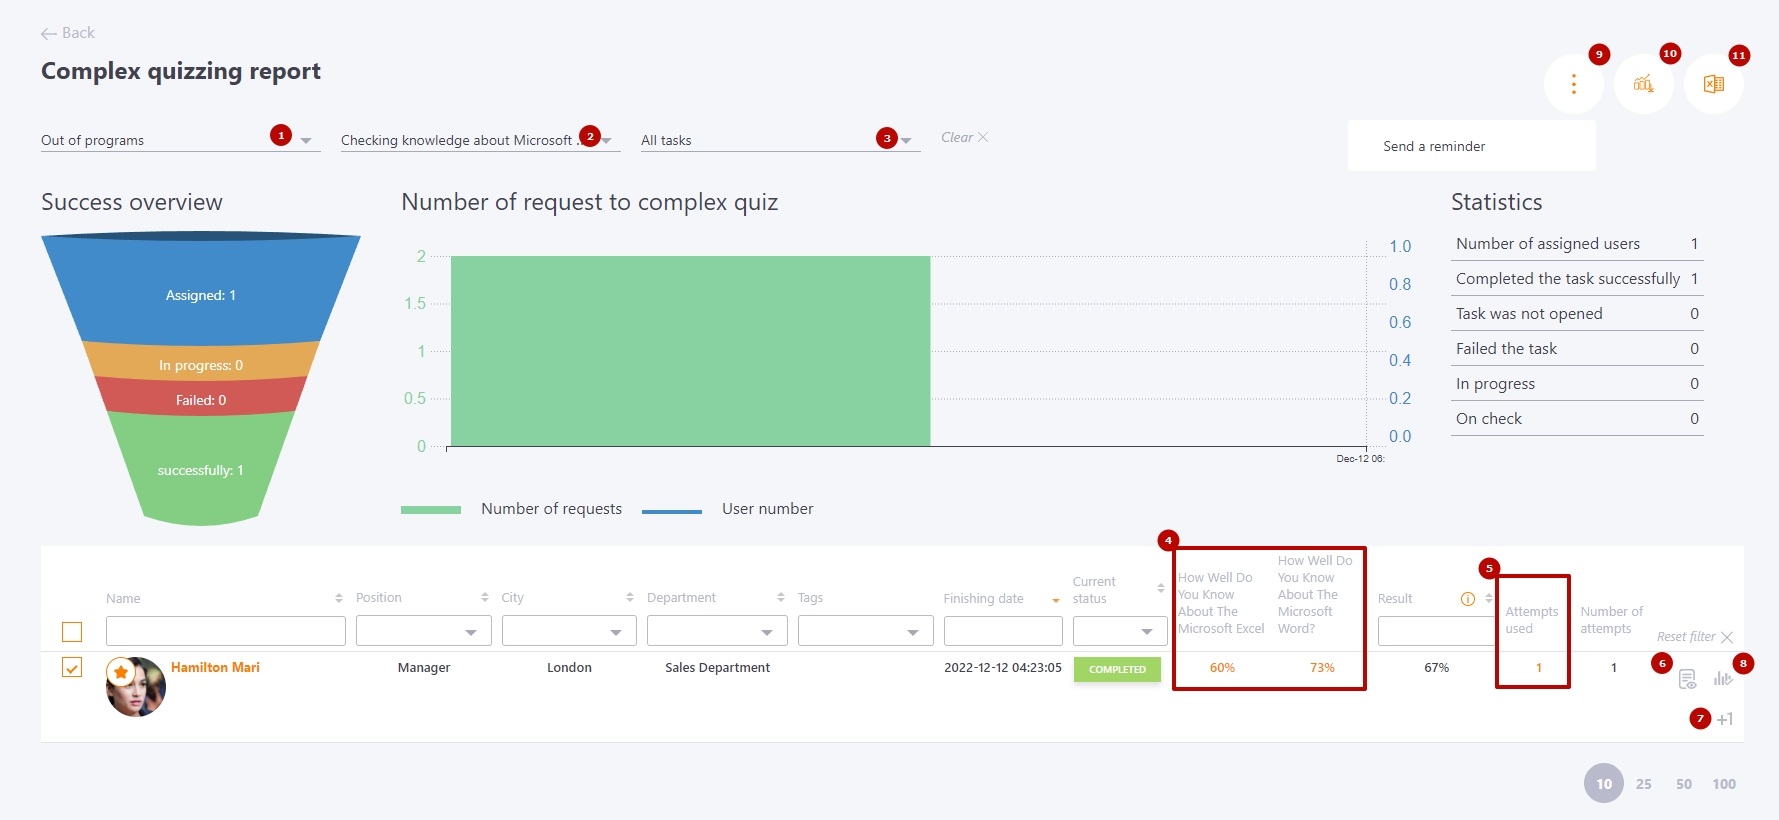
(5) - the Attempts used column displays the number of attempts that were already used. You can go to Complex quizzes report, which displays information about each user's attempt and current results.

(6) - The Read more links take you to the total answer sheet for the topic.
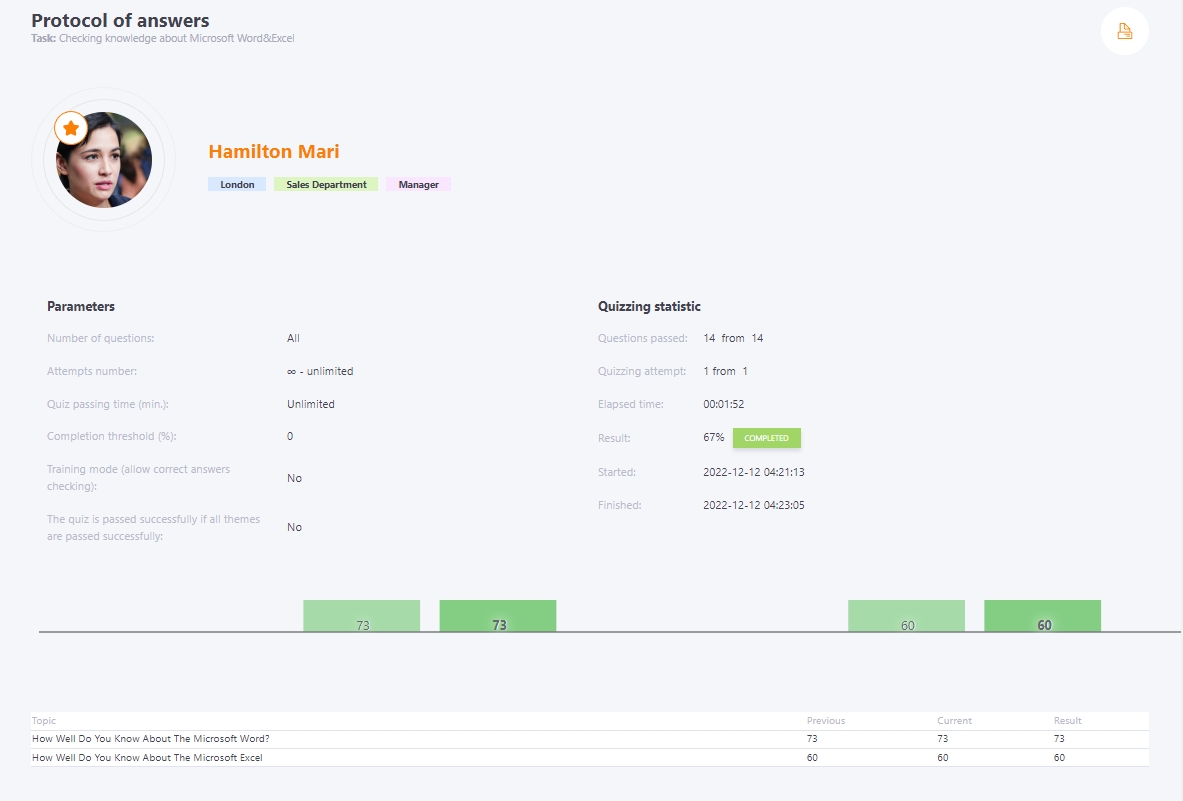
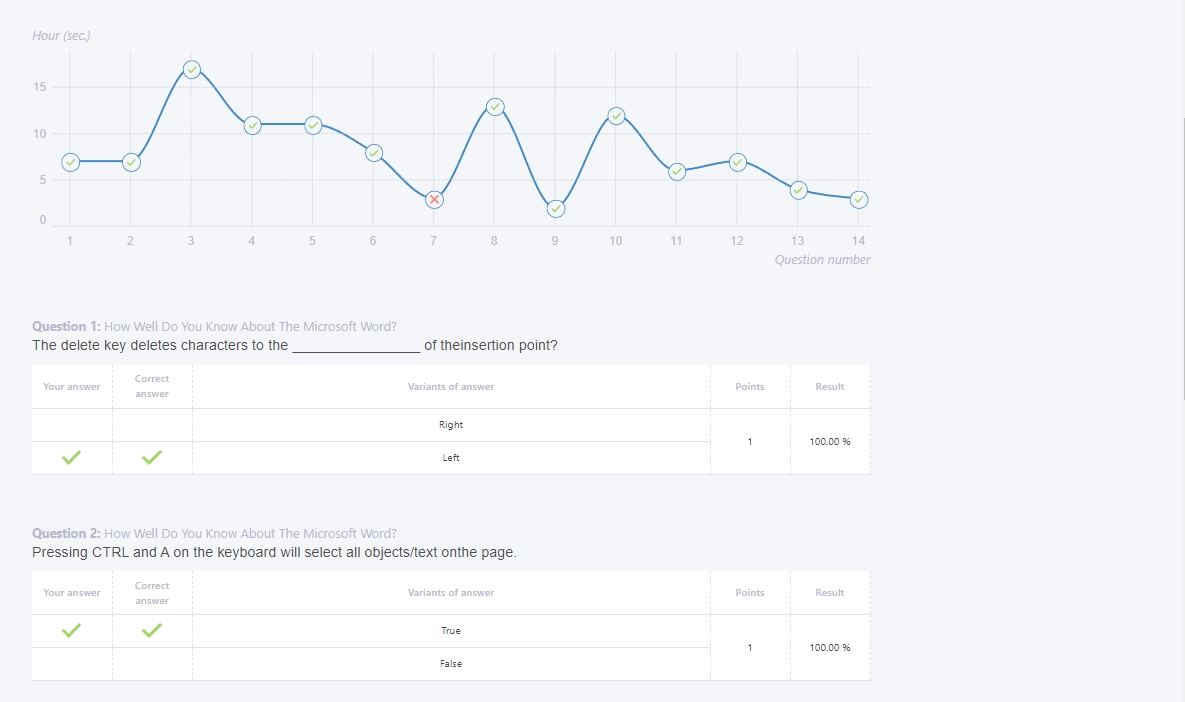
The Answers report shows quiz parameters and statistics, a graph of passing success by topic compared to the previous attempt, a table with the results by topic, the overall quiz schedule for each question, and the passing results for each question.
(7) - Add an attempt of testing to a specific User
(8) - Task status change protocol
(9) - button Actions - send reminder - the button appears after selecting Users in the table with checkboxes on the left.
(10) - Summary report in Excel - detailed results of answers to each test question on each topic of the complex quiz are exported.
(11) - Export to Excel - export the report file in xls format with the final statistics of the passage.

In some cases, the test result can be recalculated: when the composition of questions has changed, the passing threshold or other test parameters have changed. Then the "Recalculate" button will be available in the Result column. The result will be recalculated according to the new parameters without the need for the user to retake the test. More details in article Result recalculation.
