Courses report
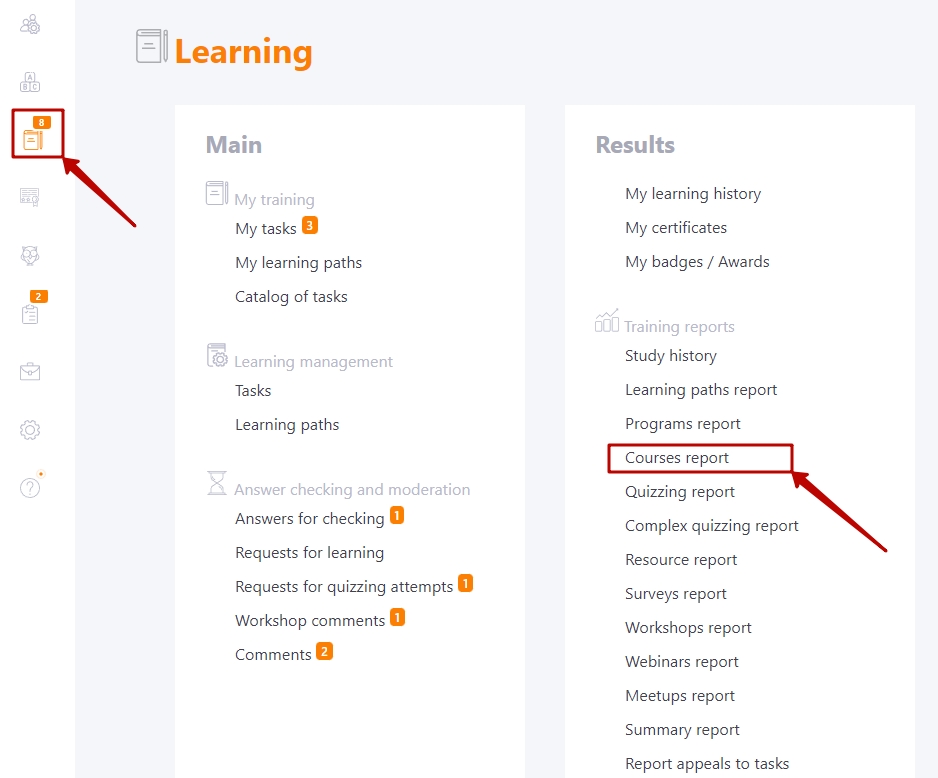
To view reports on Courses, go to Learning - Courses report menu:
To select a report, the following filters are available:
(1) -filter to select the program that includes the course. The list contains only programs with courses that are used in assignments. The default value is "Out of programs".
(2) - a filter for selecting courses. The list contains only the courses that are used in the tasks.
(3) - a filter for selecting a task name. The date of creation and the task id are displayed next to the title.
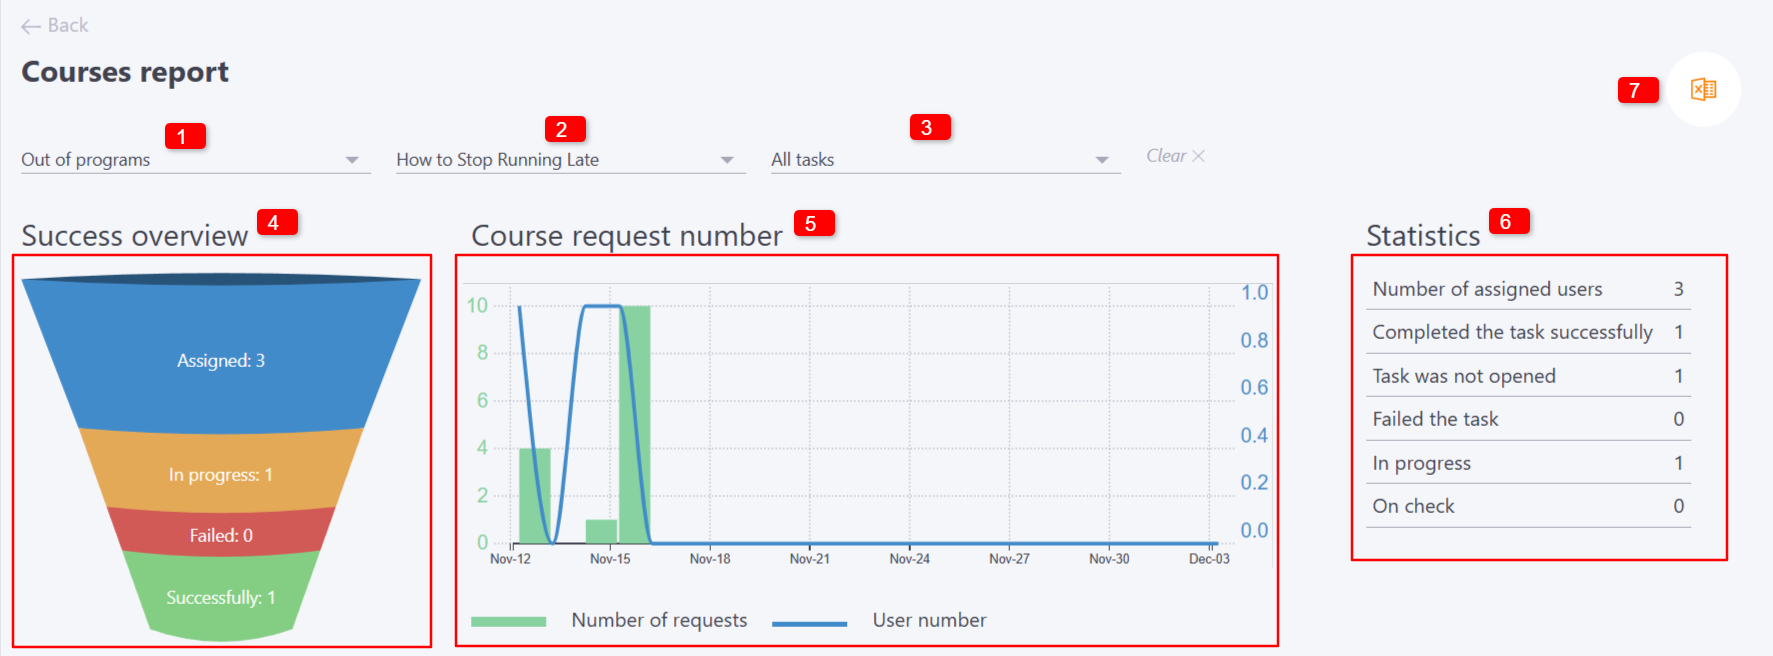
For course reports, information is also displayed in graphs:
(4) - Success overview.
The Success overview graph is built in relation to the status of users' course completion.
- Successfully - the number of users who have successfully completed the course. The status of the task for such users is "Completed"
- Failed - The number of users who have not successfully completed the course. The status of the task is "Failed"
- In progress - the number of users who have started the course. The status of tasks is "In progress"
- Assigned - number of users assigned to the task
(5) - Course request number
The Course request number graph shows how and when users have completed course tasks. The graph is built from the first access to the course. To get information for a different period, you need to set the filters (8-9) in the table. The graph responds to all changes in the filters. The graph displays two types of data:
- Number of requests - bar charts that show the number of times the user accesses resources from the course plan (Must match the data in Report appeals to tasks)
- User number - a linear graph indicating the number of users who have taken the course by individual dates.
(6) - Statistics - general statistics on the completion of the task.
It is also possible to Export to Excel (7) - download a file with a report in xls format.
The report table displays a list of all users assigned to the task. In the table, you can filter and sort the list (8).
All the tasks added to the Course Plan are displayed as separate columns (10), and you can view the percentage of completion for each of them. The grade for each course element is clickable, leading to a detailed report on the completion of this element by this user. The Final result column displays the overall result of the course.
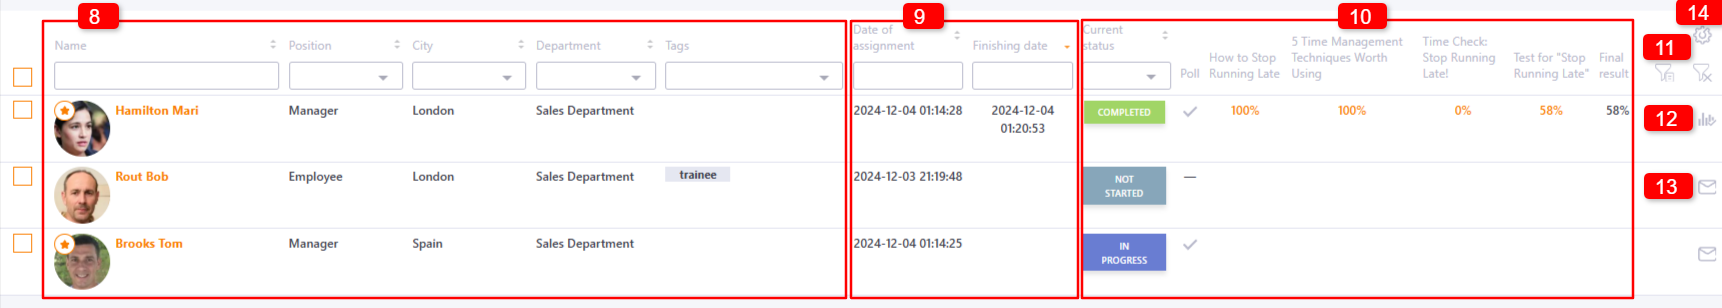
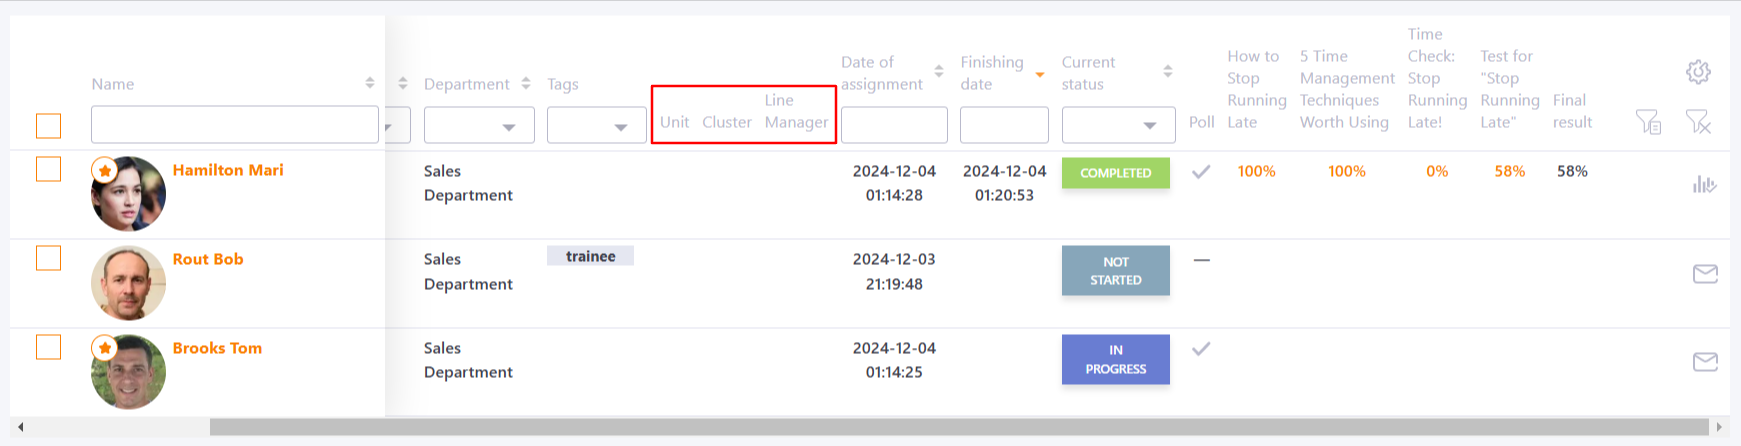
When viewing a course report, a filter by organizational structure is also available (11), which can be reset. To view changes in the status of tasks, there is a Protocol of changes in the status of tasks (12). In addition, it is possible to send users a reminder about the need to complete a task-course (13).
After pressing the button of report columns settings  (14), you can manage displaying of the columns in the report, including additional user fields:
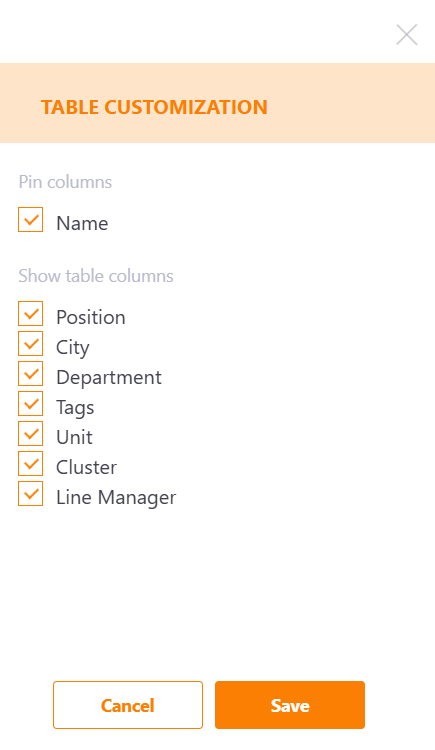
After saving changes, the report will display all the selected columns, and if you select the setting "Pin columns", the selected columns will be pinned, and the report will be scrollable horizontally using the slider:
These settings also affect the report in Excel, the selected columns will be displayed there as well:
