Workshop report
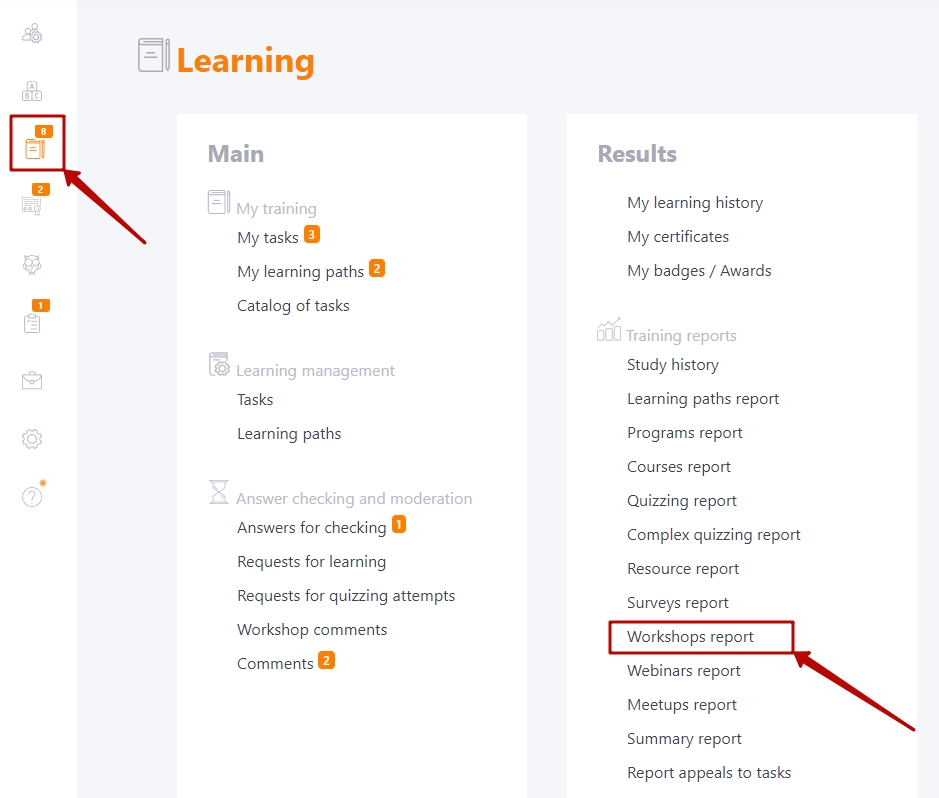
To view the Workshop reports, go to the menu Learning - Training reports - Workshops report:
Workshops can be used as separate tasks or included in the Course plan or Program structure.
Use filters to select the required task:
- (1) - filter to select programs that include workshops. Only programs with workshops used in assignments are displayed. The default setting is "Out of programs".
- (2) - a filter for selecting a course with workshops. The default value is "Out of courses".
- (3) - filter to select the name of the workshop to search for tasks;
- (4) - a filter for selecting task titles. The date of creation of the task and its ID number are displayed along with the title.

The Success overview graph in the form of a funnel and the Number of requests for the workshop graph visually display information about the workshop.
The Success overview graph is plotted against the status of tasks performed by users.
- Assigned – number of users assigned to the task.
- In progress - the number of users who are in the process of completing a task with a workshop.
- Failed - the number of users who unsuccessfully completed the task. Task completion status - Failed.
- Successfully - the number of users who have successfully completed the task. The task status of such users - Completed.
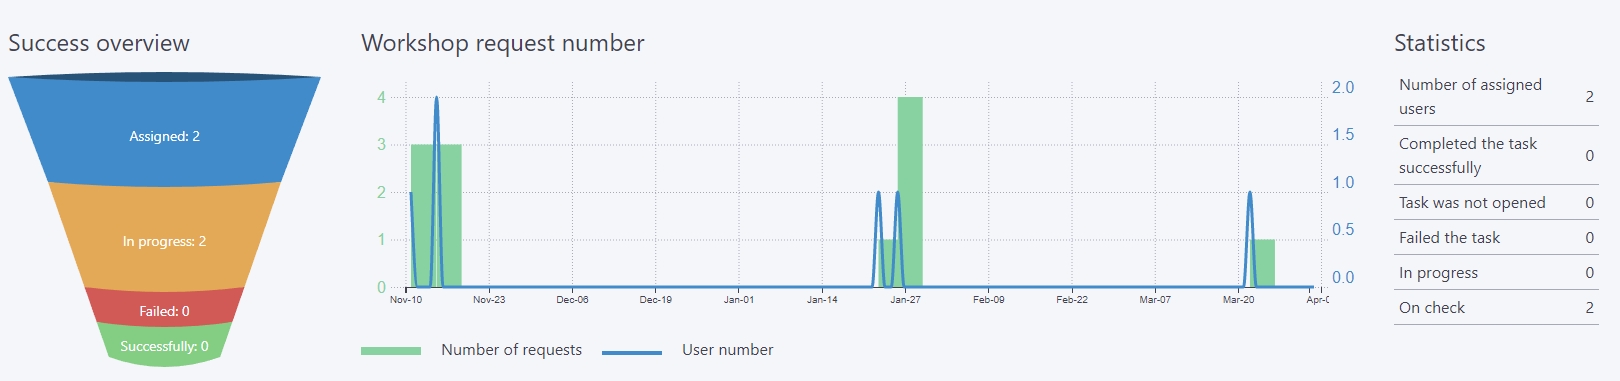
Workshop request number - the graph shows how and when users completed the task. The graph is built from the first access to the task. To get information for a different period, you should set filters in the table with users. The graph responds to all changes in the filters. The graph displays two types of data:
- Number of requests - bar charts that display the number of times the task was opened (Must match the data in Report appeals to tasks)
- User number - a linear graph that shows the number of users who have completed the task in relation to the dates.
Statistics - number of users regarding the status of the task
- Number of assigned users
- Completed the task successfully
- Task was not opened
- Failed the task
- In progress
- On check
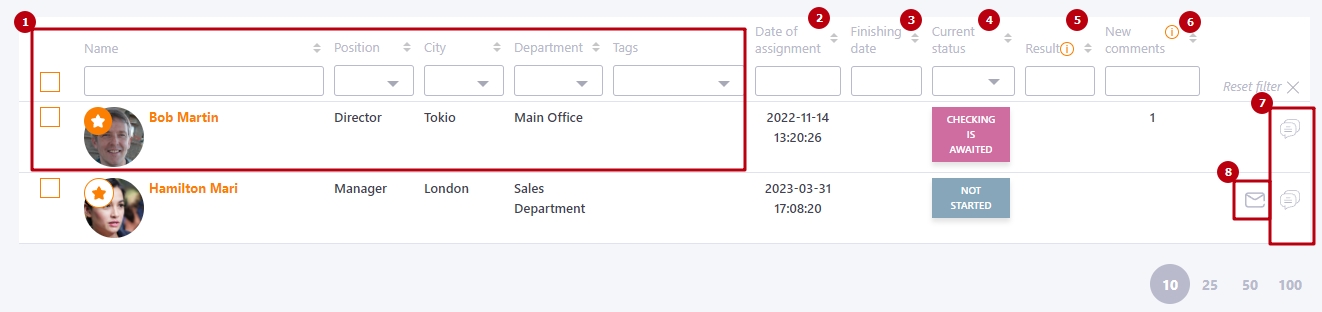
The following table displays the users assigned to the task and the results of the task:
(1) - information about assigned users - avatar, first and last name, position, city, department, tags. Filters and sorting are available for all fields.
(2) - date of task assignment.
(3) - date of the task completion (date of the curator's evaluation).
(4) - current status of the task.
(5) - result in %.
(6) - new comments - the number of new comments for the curator that they have not yet visited.
(7) - switch to viewing comments on the workshop from the user.
(8) - sending reminders about task completion. (Find more in Tasks - Remind about incomplete tasks - manual sending)