Survey report
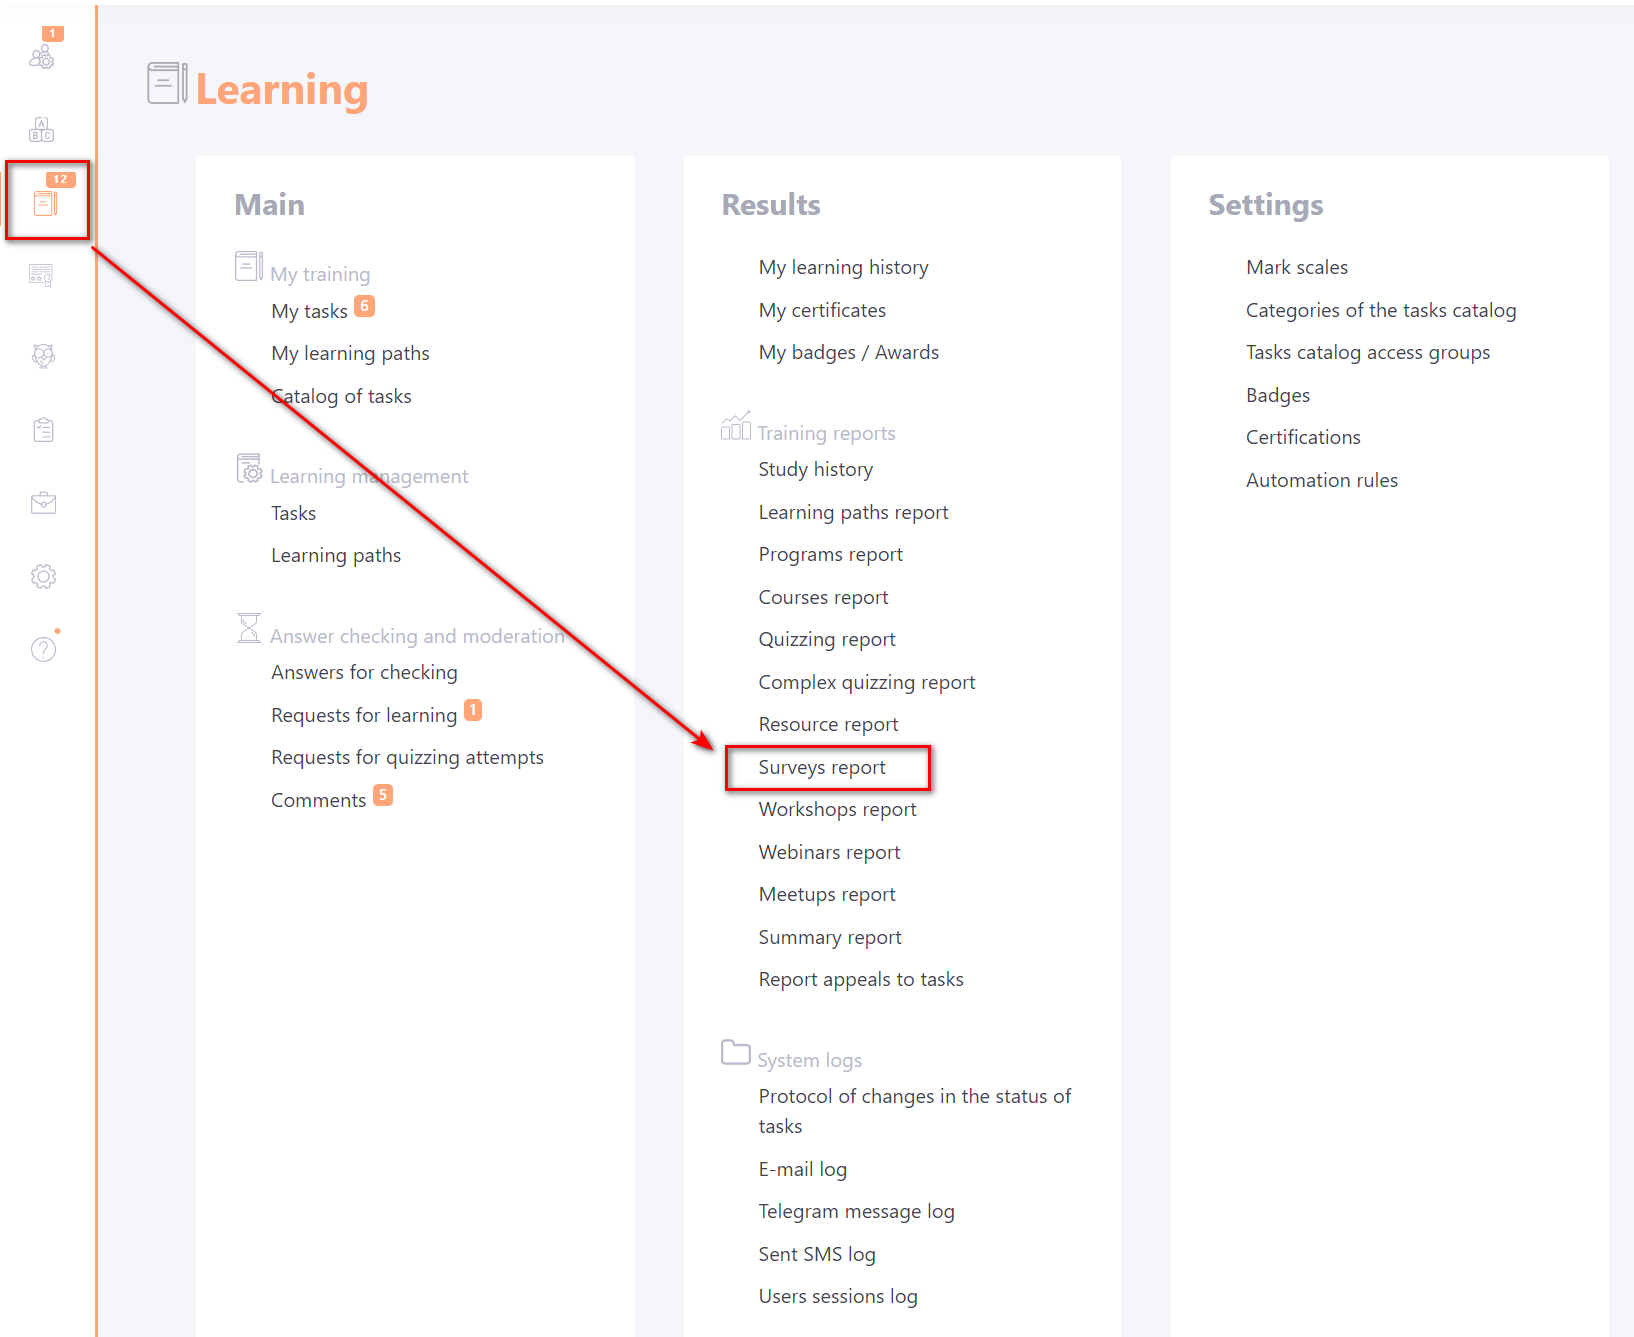
To view survey reports, you need to access the Learning - Surveys report menu:
Survey report
You can use filters to find the report you want:
- (1) - filter with a list of programs that include surveys. Only programs with which tasks have been created are displayed.
- (2) - filter to select courses with surveys. Only courses that use surveys are listed;
- (3) - filter for selecting surveys that are used in individual tasks;
- (4) - filter for selecting task titles. Along with the tasks title, the creation date and Id number are displayed;
- (5) - button to reset filters.
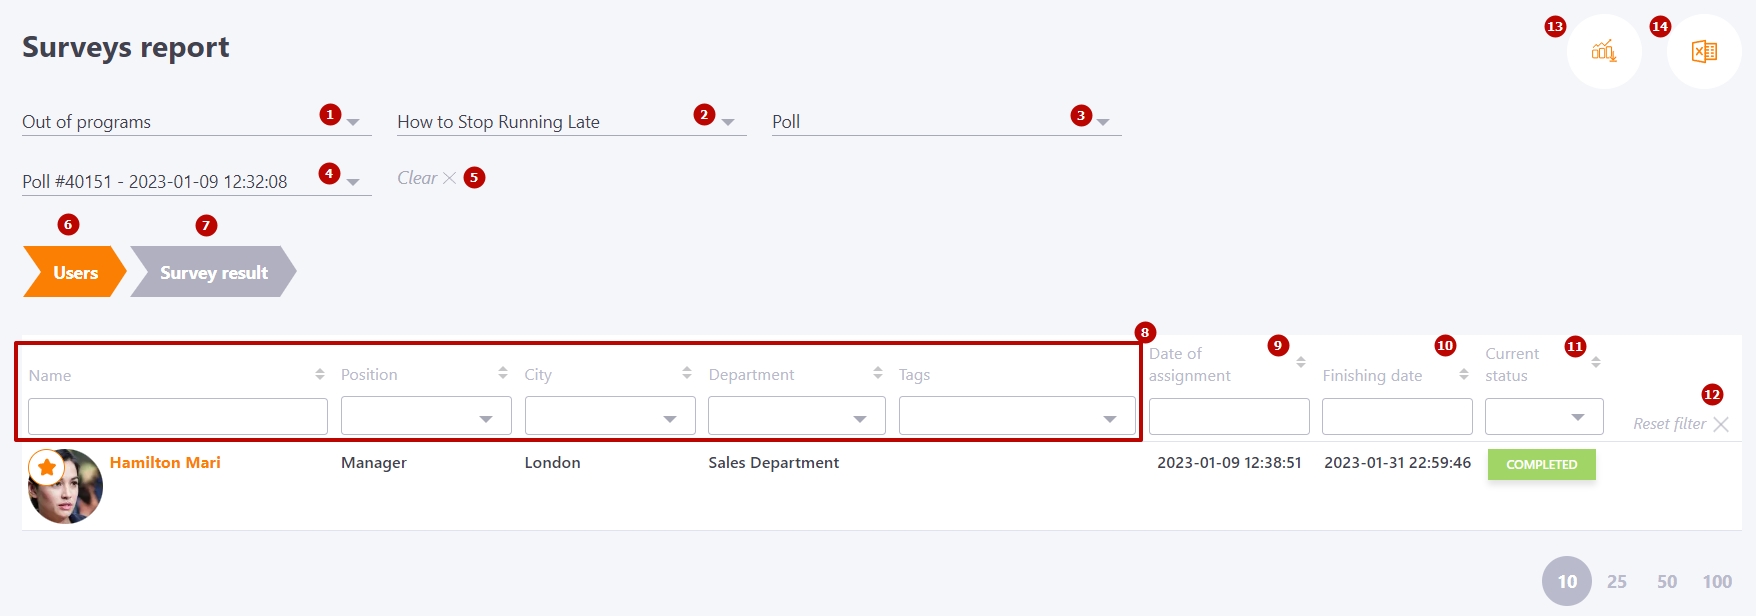
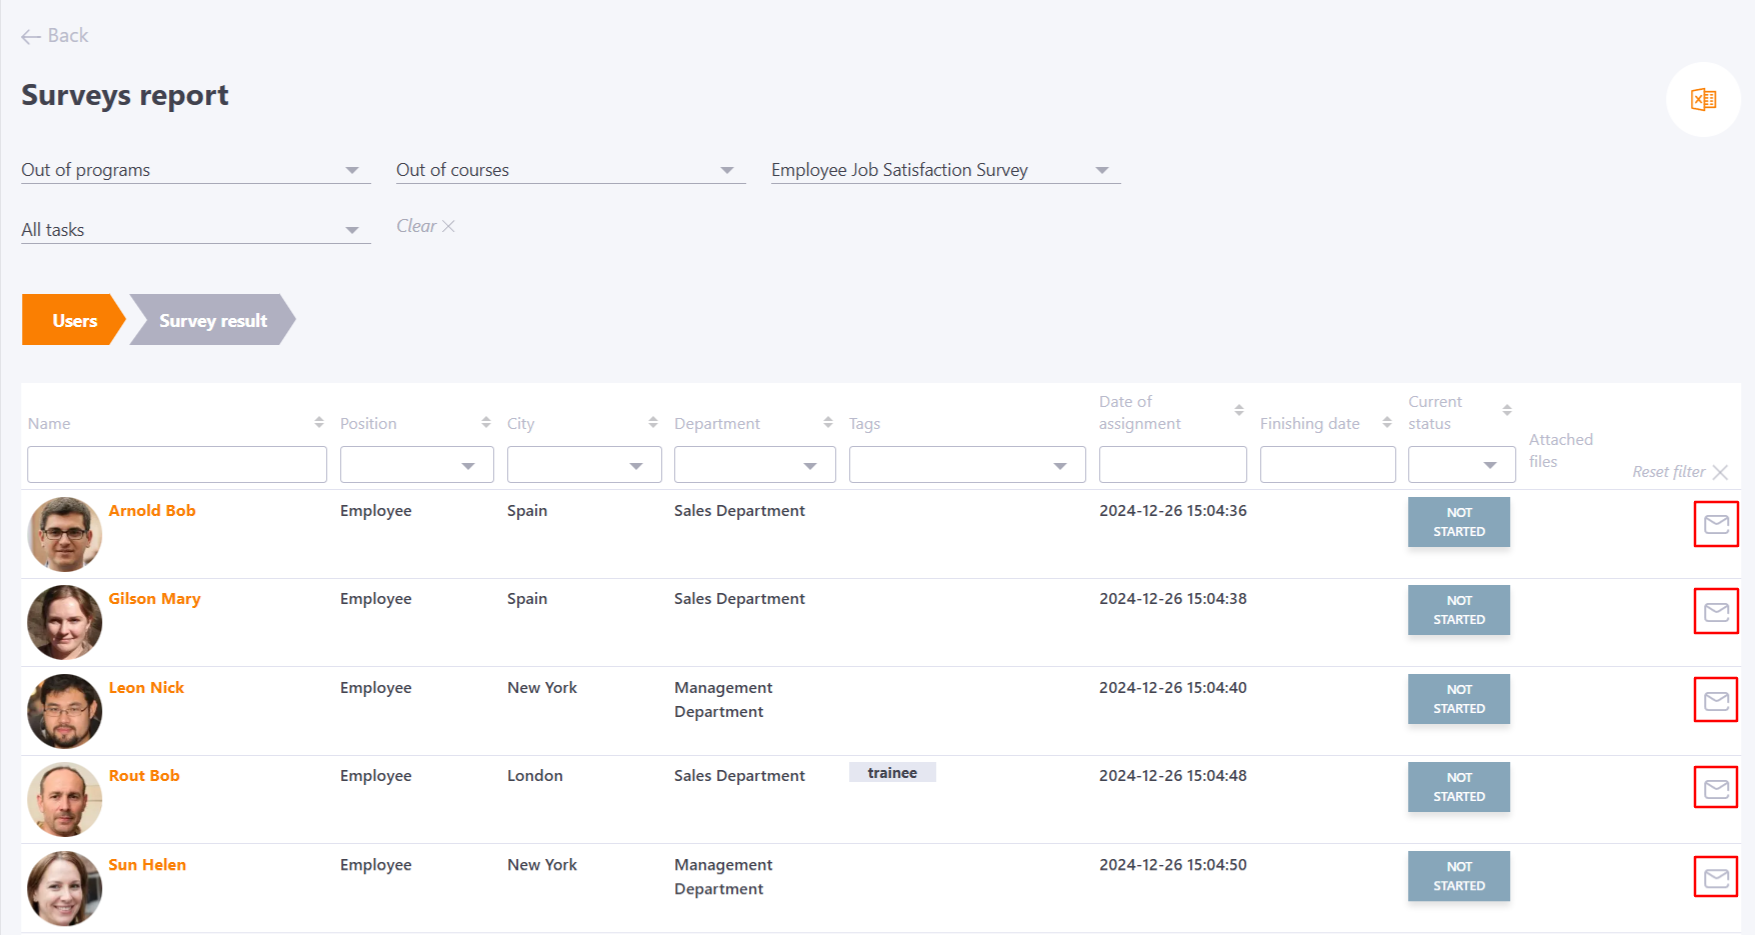
The Users (6) tab displays the following information:
- data on Users (8): Full name, Position, City, Department, Tags. By all these parameters, you can filter and sort (in alphabetical order) data to quickly find the information you need.
- Date of assignment (9) and Finishing date (10) - Date and time of appointment and completion of the Survey. You can sort data by these parameters.
- Current status (11): Done, Not Started. It is also possible to filter the data.
- Reset filter by clicking on the button (12).
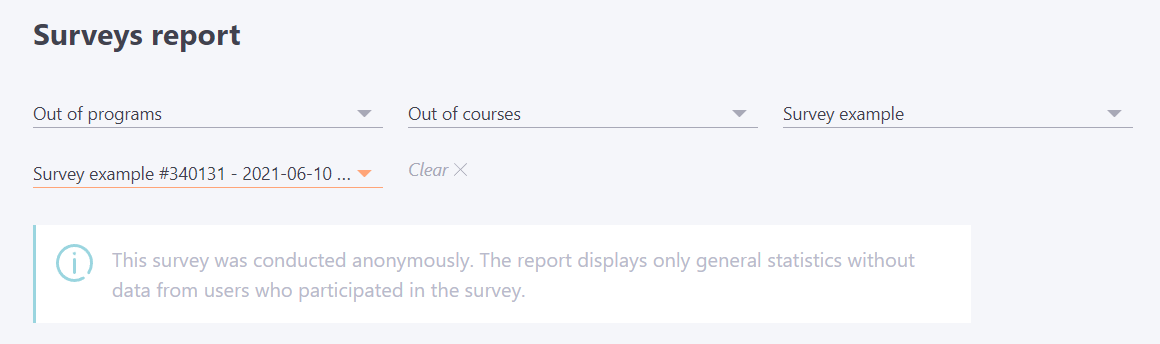
- (13) - Detailed report in Excel - downloading information on the answers of each user. Detailed report is not available for anonymous surveys.
- (14) - Export the report to Excel - exporting general survey results to Excel.
To view the results of the Survey, go to the tab with the same name: Survey Results (7).
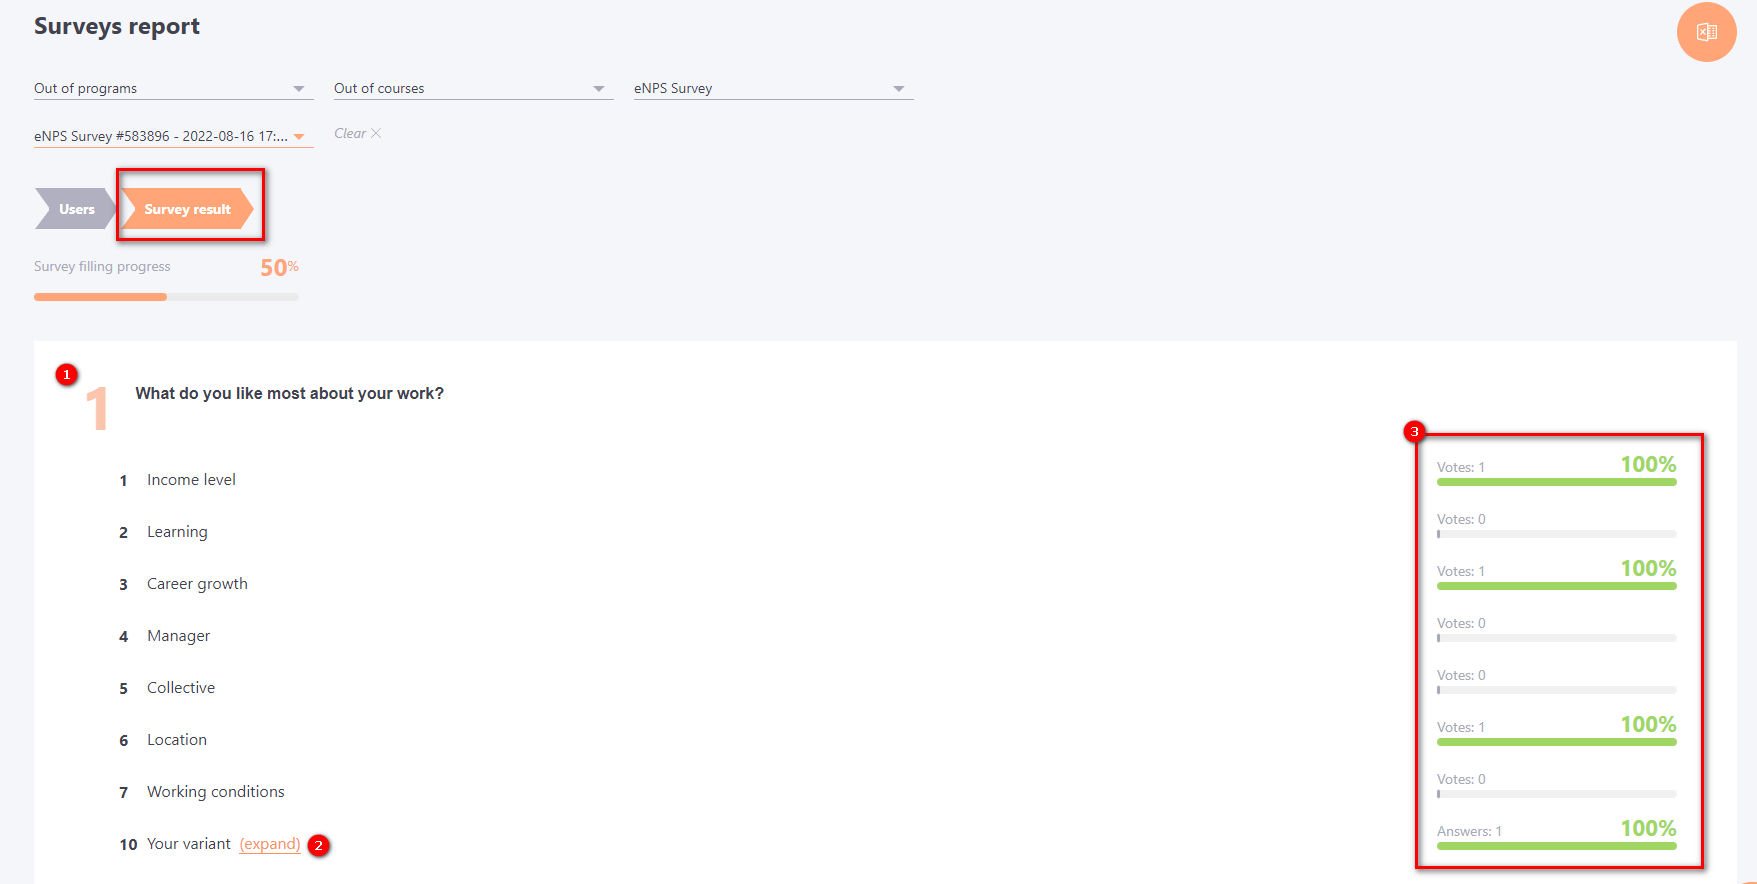
The Survey Report page - Survey Results tab displays a list of questions (1) and response statistics (3) for those Users that were selected on the first tab - Users.
Users can give free answers to some questions. You need to open links to view (2).
The User's answers to the questions are immediately displayed in the Survey Report, even if the User has not completed the Task to the end. Incomplete surveys will be displayed in the report with the status "In Progress". But the answers that users gave immediately fall into the Survey Results.
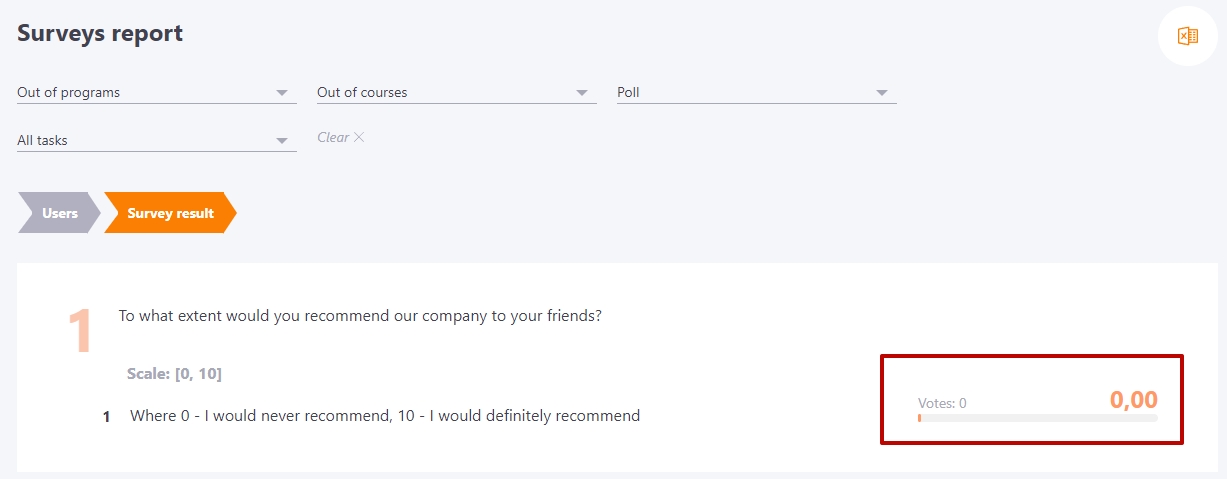
The report for questions of the type On scale shows the average value of the points scored. (Read more here: Scale score questions).
If the following options were enabled at the stage of Adding a question of the On scale type:
- "I can't answer" - then when choosing the "can not answer" option, the User's answer is not taken into account when calculating the result and is not added to the total number of votes:
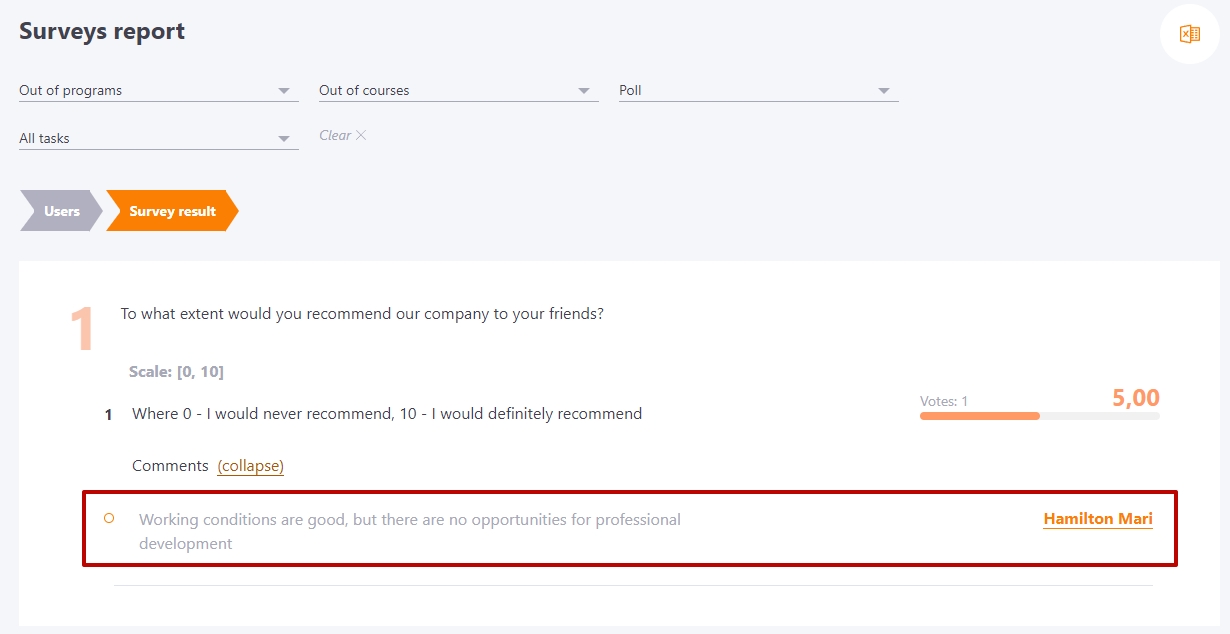
- Allow commenting on the answer if the selected grade is less than or equal to the set value - The option is displayed like this:
Survey reminders
On the survey report page, you can send reminders to users who have not yet completed the survey. There will be a corresponding button opposite them in the user list table:
You can also send reminders to several users at once. To do this, select the required users with checkboxes, and tap Send a reminder on the Actions button:

Displaying surveys in other reports
Surveys can be used as components for courses and programs as well as individual tasks. To assign a survey to users in a task, you must create a new task based on the survey. You can read about this in Creating tasks-surveys.
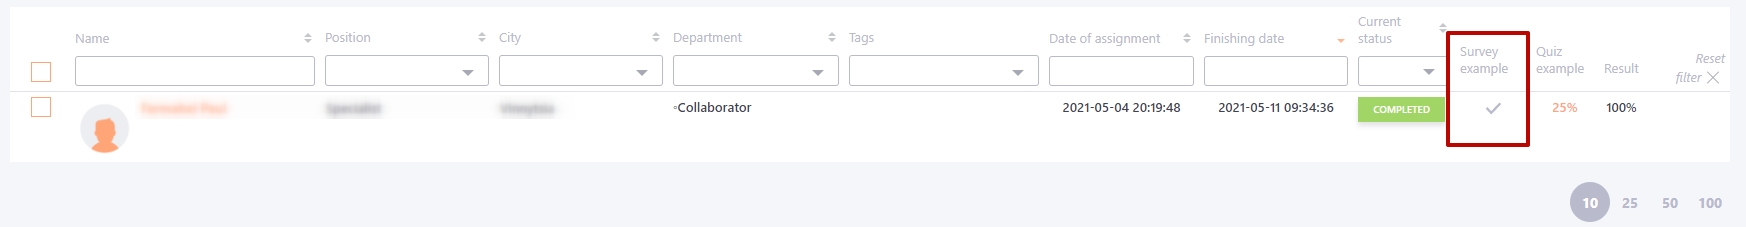
If a survey has been added as part of a course or program, the report will display a check or dash in the survey result column, depending on the status of the survey. If the survey has been completed by the user, clicking on the check mark will take you to the surveys report page:
Export report to Excel
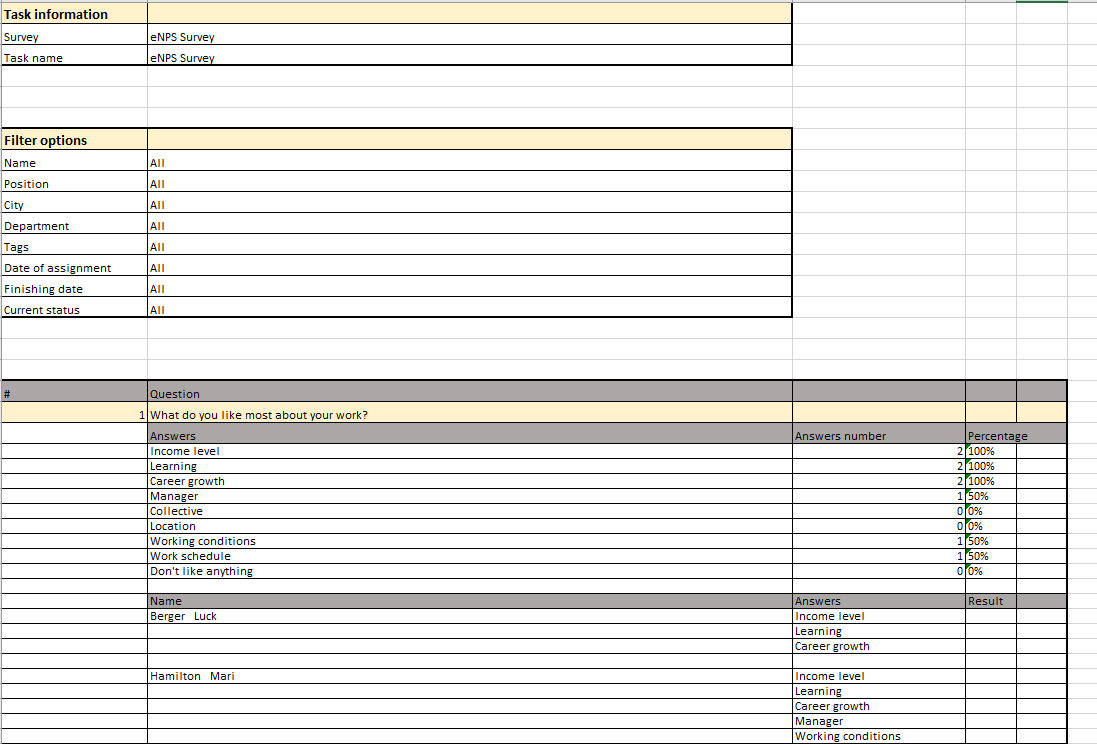
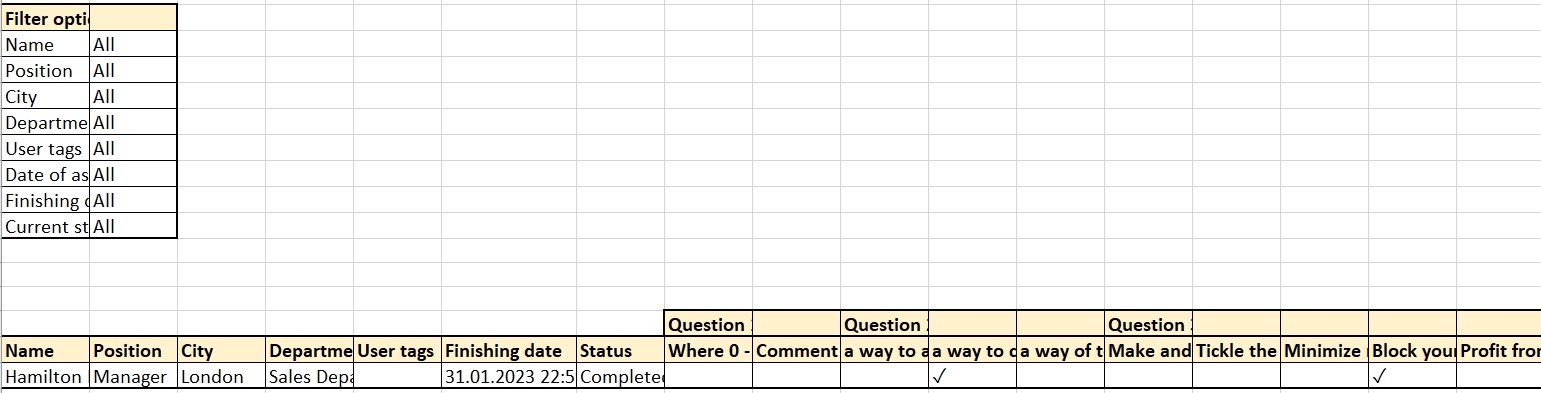
When downloading the Detailed report in Excel, the file contains data - attributes of users who took part in the survey and their answers to each question:
After clicking on the Export to Excel button, you will receive general statistics on the survey: