Users sessions log
The Collaborator system provides various tools for monitoring the actions and activities of users. Thus, it is possible to easily determine who and when logged in and performed various tasks.
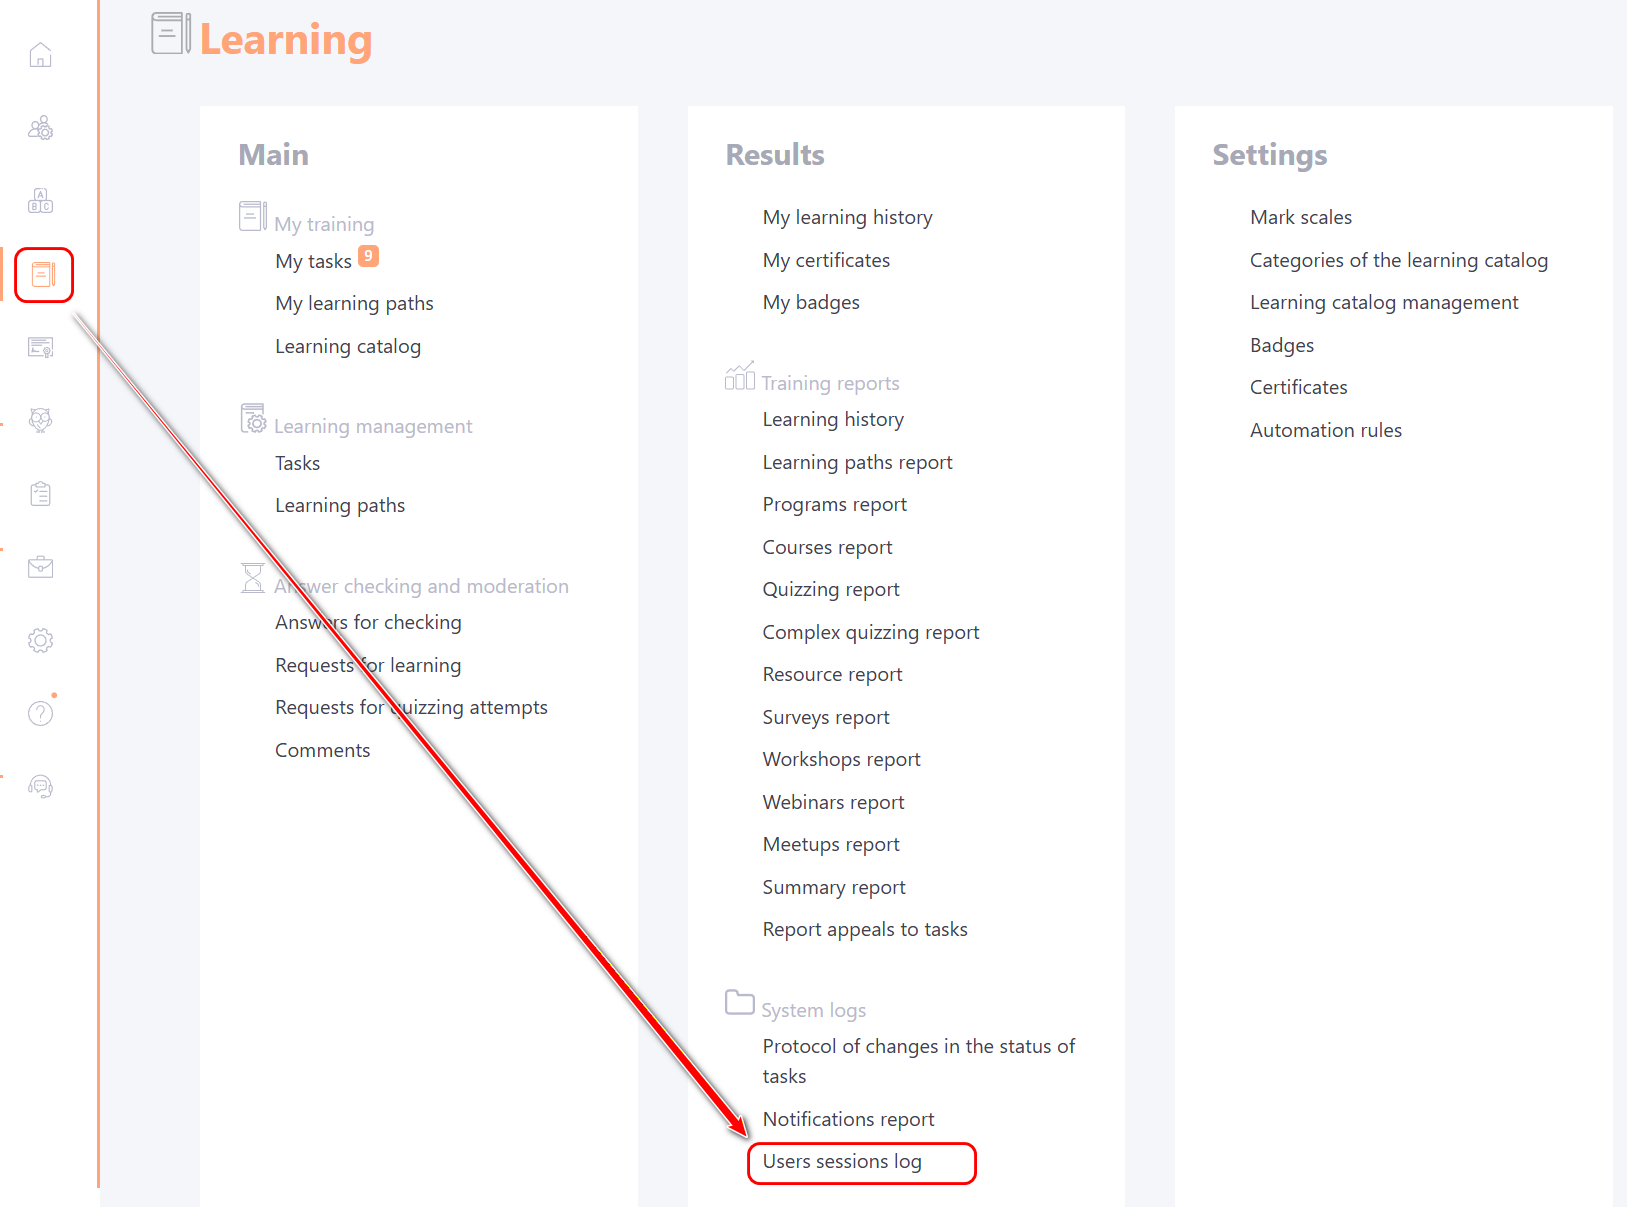
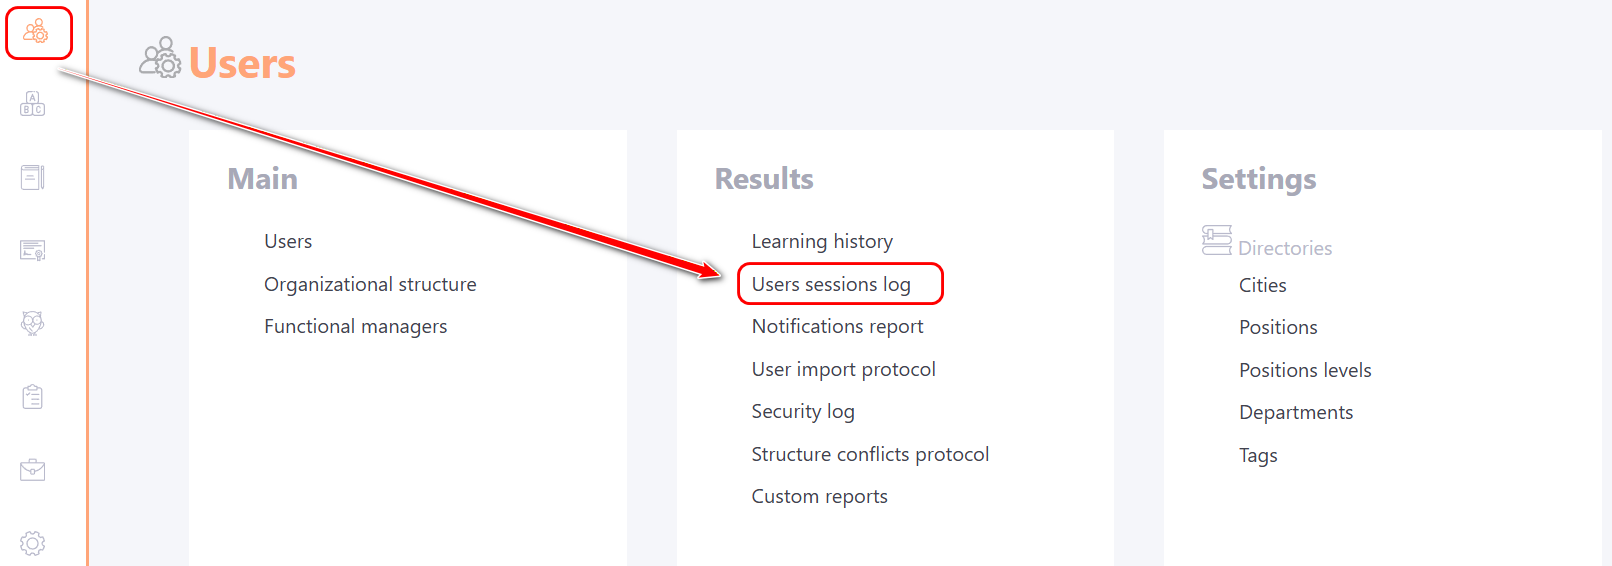
One of the tools is the User Session Log. You can view it in 2 ways:
- via the menu Learning - System Logs - User Session Log:
- via the menu Users - Results - User session log:
Collaborator logs logon events. The Users sessions log makes it easy to find out who used the system and when. The log stores user session data for a defined period, which depends on the tariff plan selected by the client (more details: Data storage policy).
The session log stores information not only about the user and the time they spent in the system. It also records the IP address of the computer on the network, the operating system and browser used.
The result allows you to find out, for example, how many users use the system from mobile devices, from which network addresses the system is most often accessed, and which browser is the most popular among users.
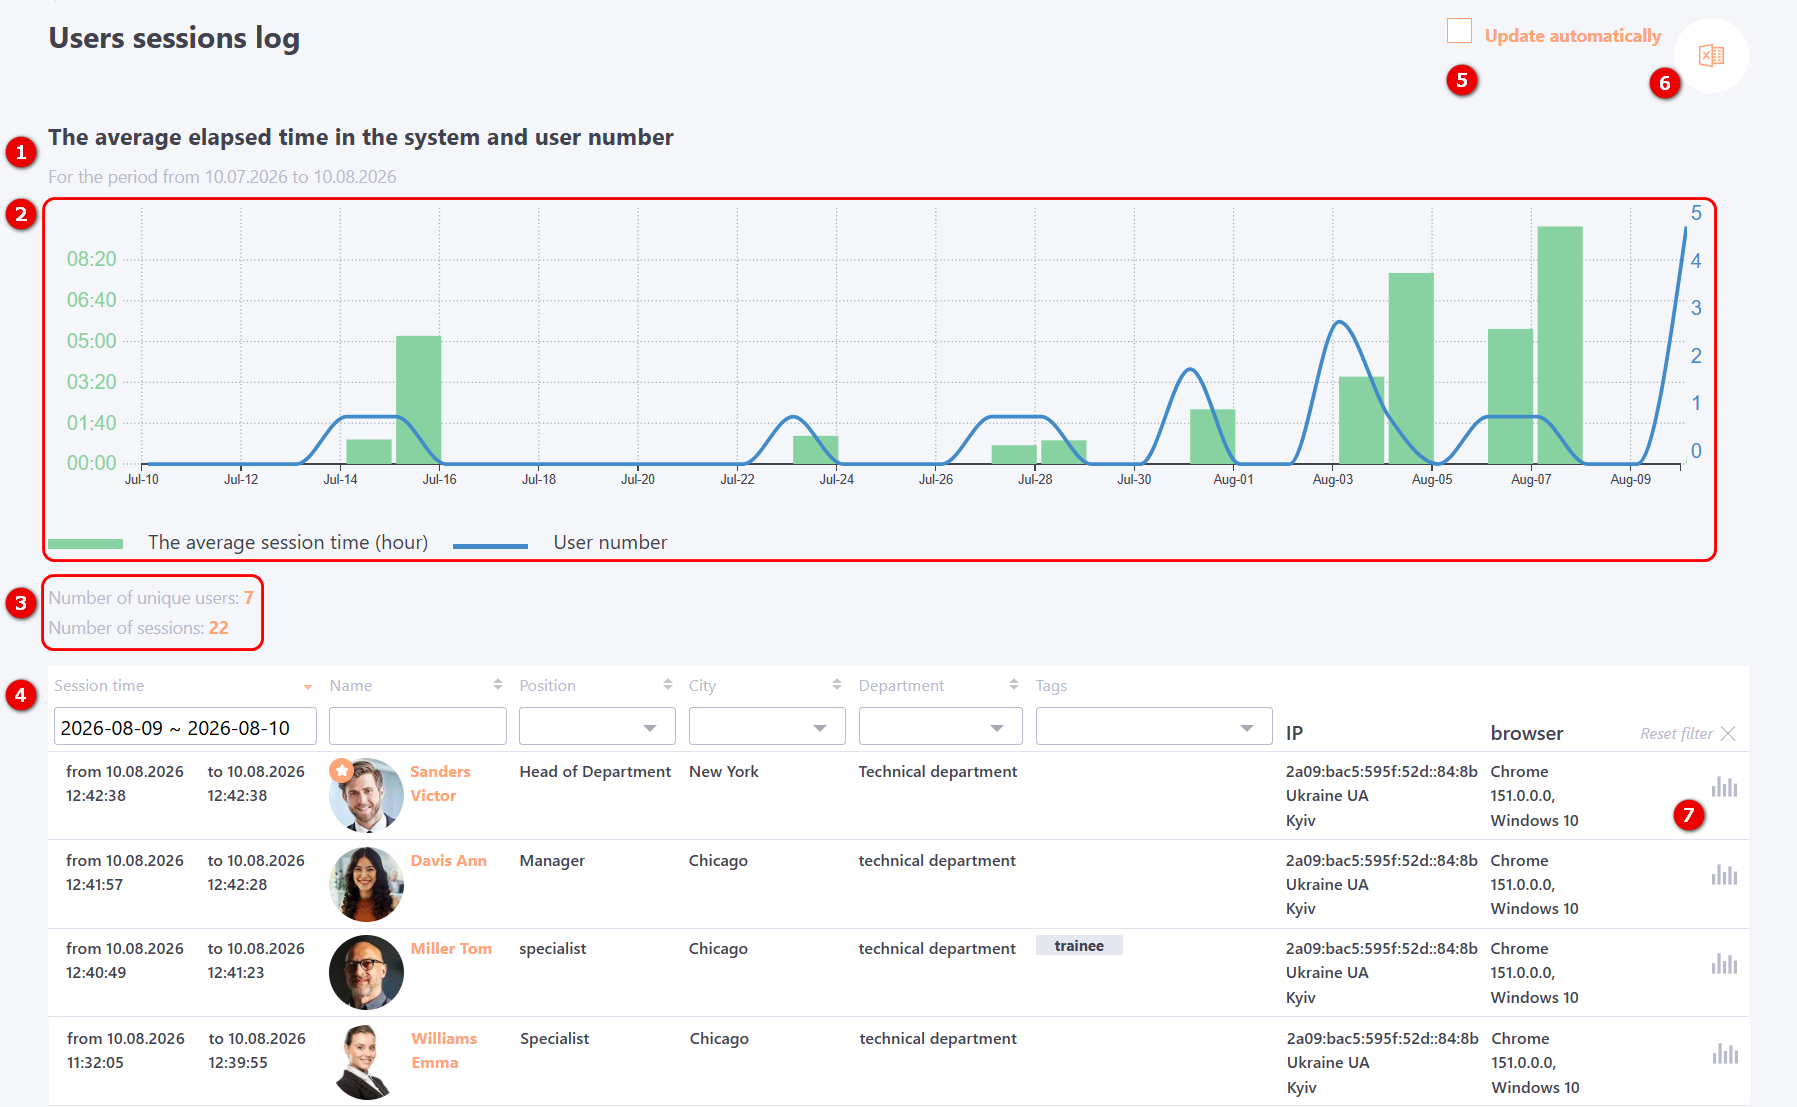
By default, when you open the page, the log displays sessions for the last 30 days from the current date. The currently selected period is displayed under the page title (1).
Below is the graph The average elapsed time in the system and user number (2). The columns on the graph are the average session time for each day in hours. The curve on the graph is the number of unique users who accessed the portal each day.
By default, for the current period (30 days) are displayed (3):
- The number of unique users - is the number of users who logged in during the selected period, with each user being counted only once, regardless of the number of logins.
- The number of sessions - is the total number of all logins (sessions) to the system during the same period. One user can create multiple sessions.
In the table, you can specify the desired Session Time (4), which may differ from the current period (1). In this case, the indicators of the number of unique users and the number of sessions (3) will be displayed for this selected Session Time (4).
It is possible to filter the log information by various parameters and export the result to Excel (5).
The Update automatically (6) button starts automatic refreshing of the page with user sessions. That is, when you view the session log page, the data on it will be updated in real time until it is closed.
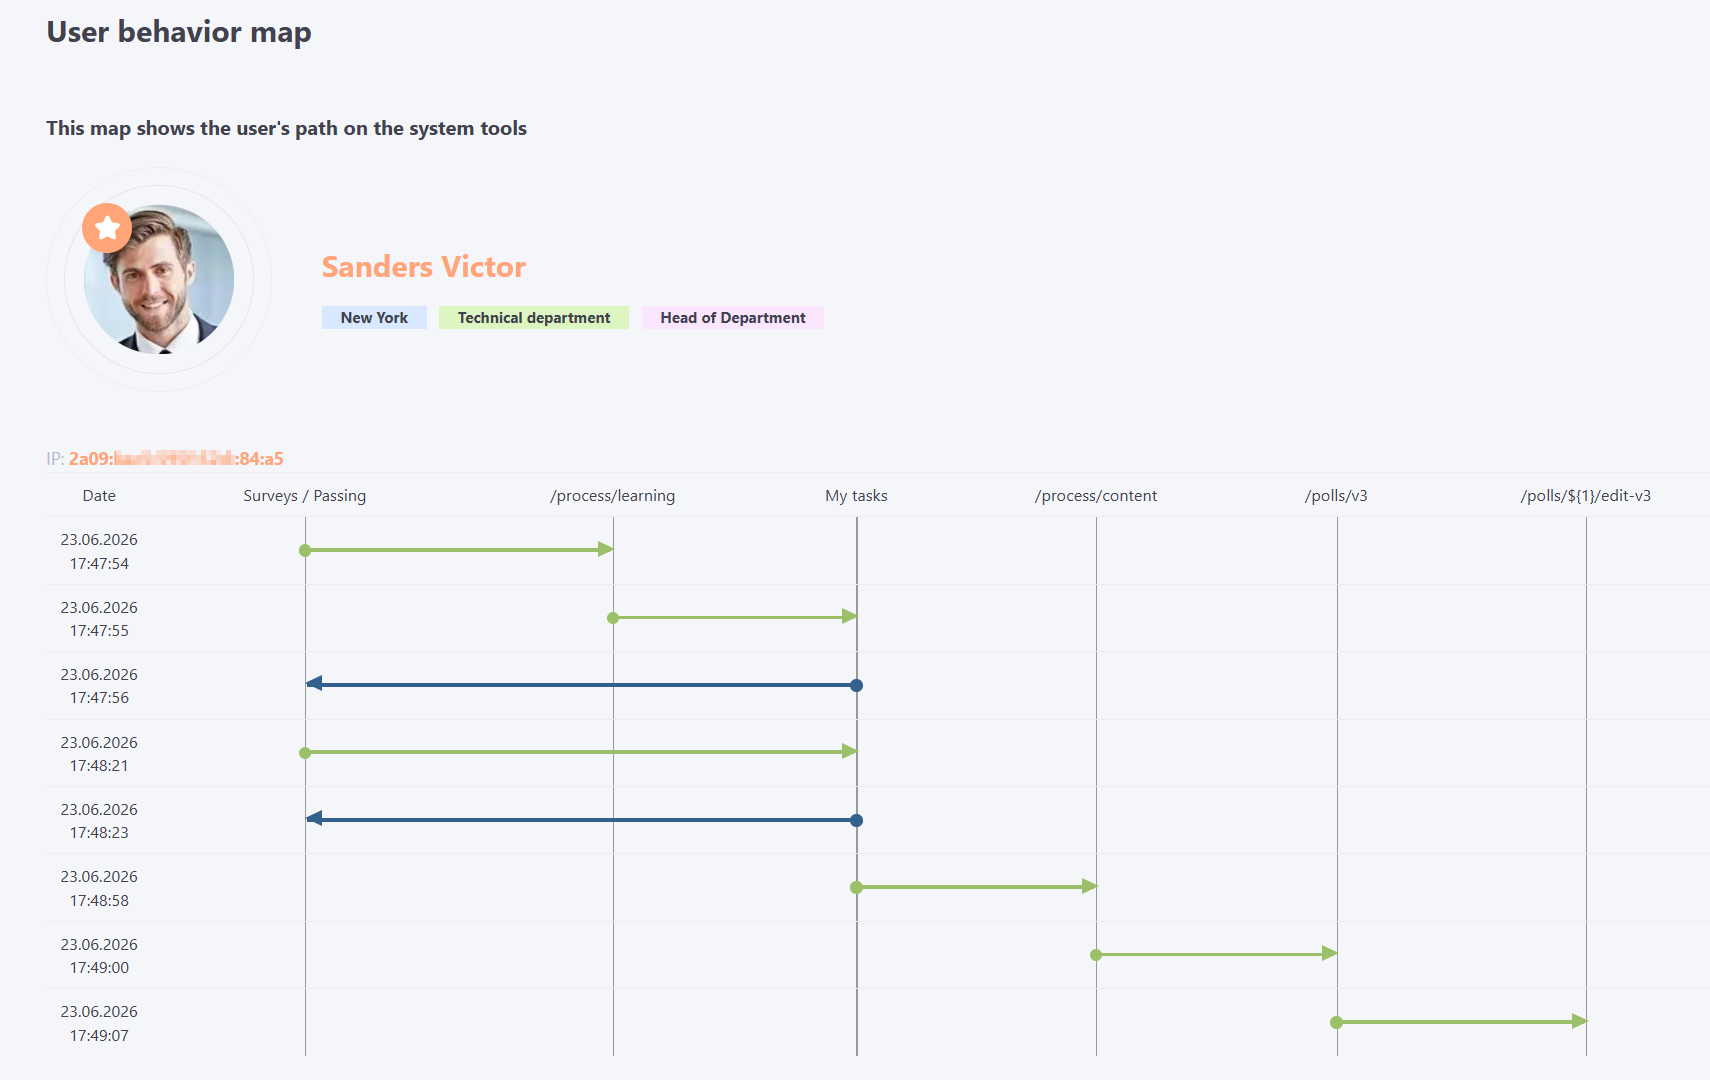
By clicking on the User behavior Infographics button (7), you can view a map of the transitions of a specific user during a session.
User behavior Infographics
The system automatically records the sequence of user transitions between portal pages within one session.
The User Behavior Map page displays the user's paths through the system tools in the form of a diagram. This allows you to clearly view the sequence of user actions, determine which tools and sections they visited, and analyze their interaction with the portal