- Assessment results
- Self-assessment
- Gap analysis between self-estimation and assessment of others
- Gap analysis between assessment and norm
- Profile mark analysis by groups
- Matrix analysis self-estimation and assessment of others
- Comments on assessment
- Export the Assessment report to Excel
- Manager viewing of assessment by criteria report
- User viewing of assessment by criteria report
Assessment report and viewing the results of the assessment by criteria
Assessment results
Based on the results of the assessment by criteria, reports are generated with a detailed analysis of the assessment results, except for the "Feedback collection mode".
The administrator can navigate to the Assessment Report page in the following ways:
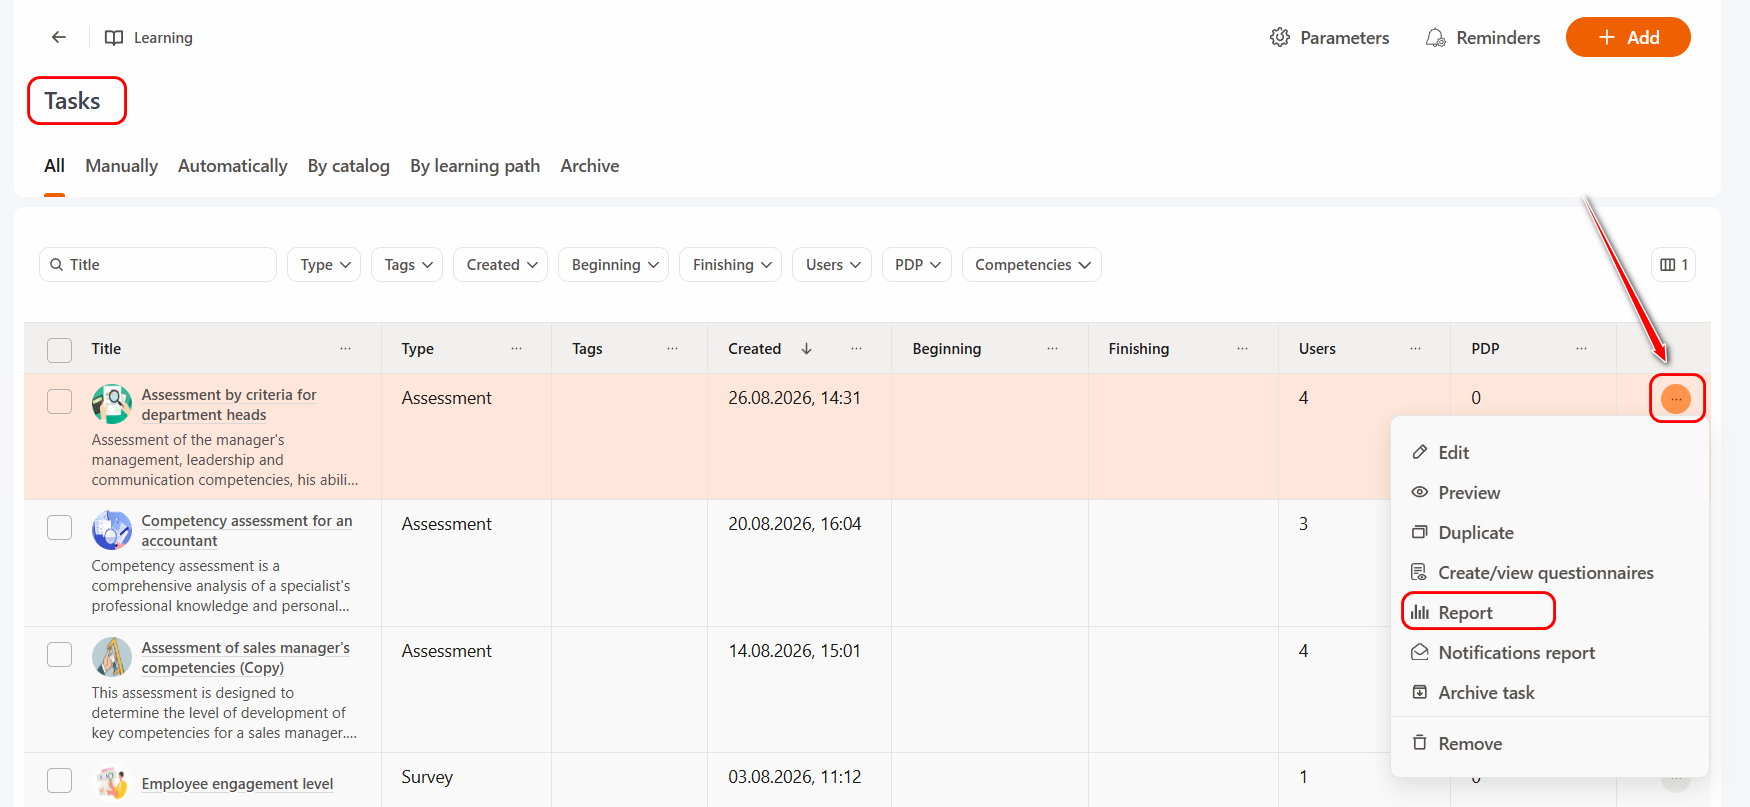
- On the Tasks page next to the required task click Actions button - Report:
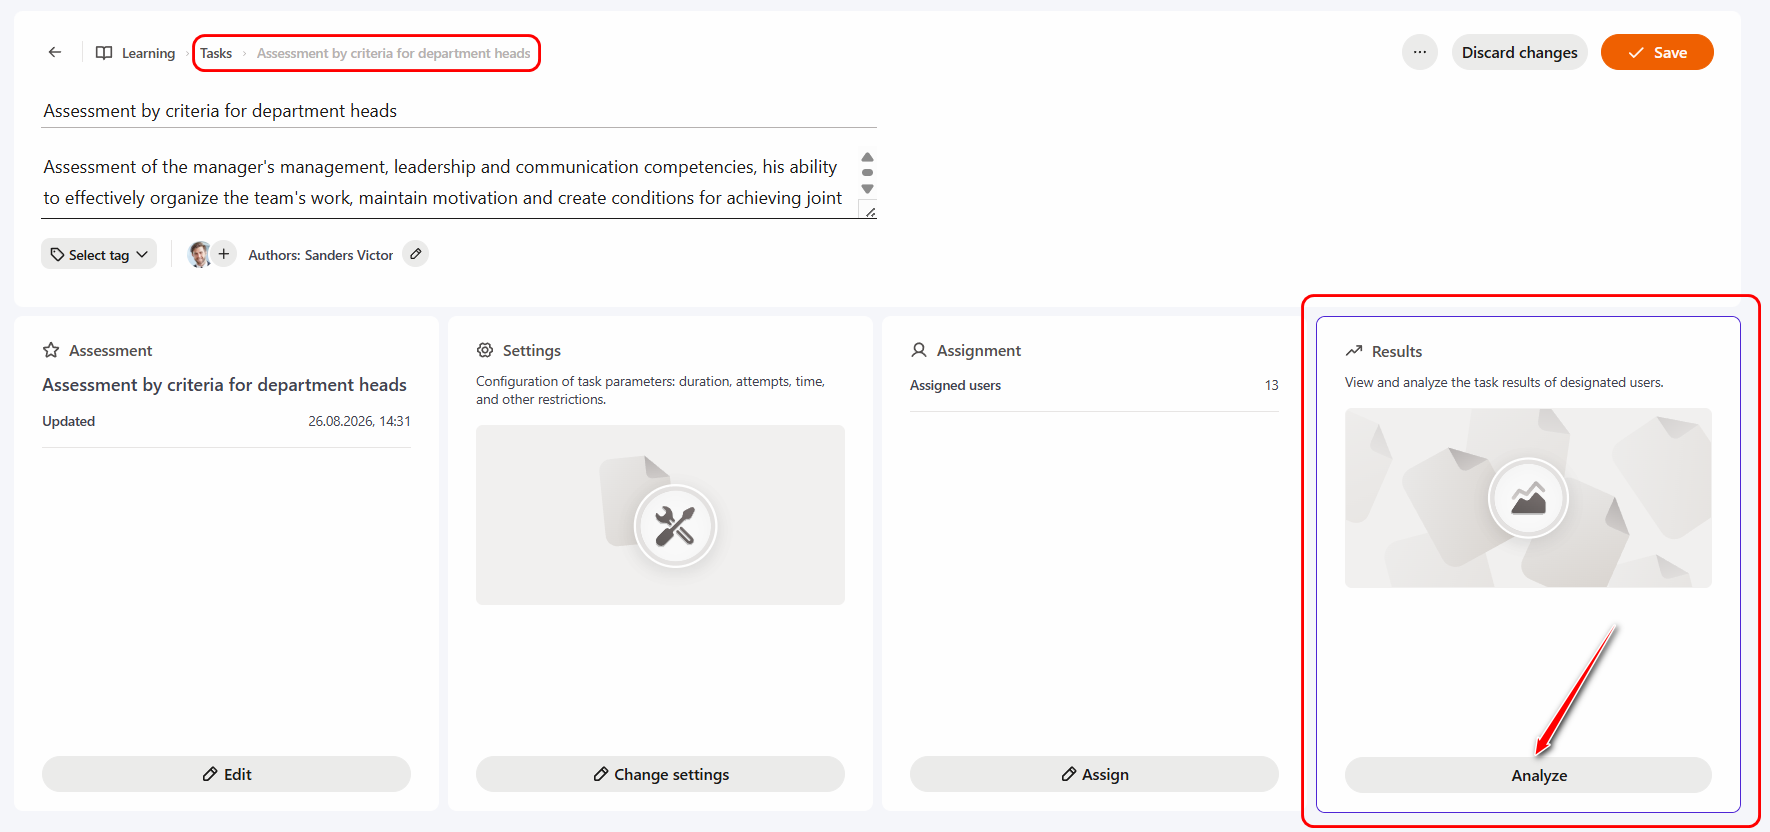
- On the Task – Assessments page, in the Results section click the Analyze button:
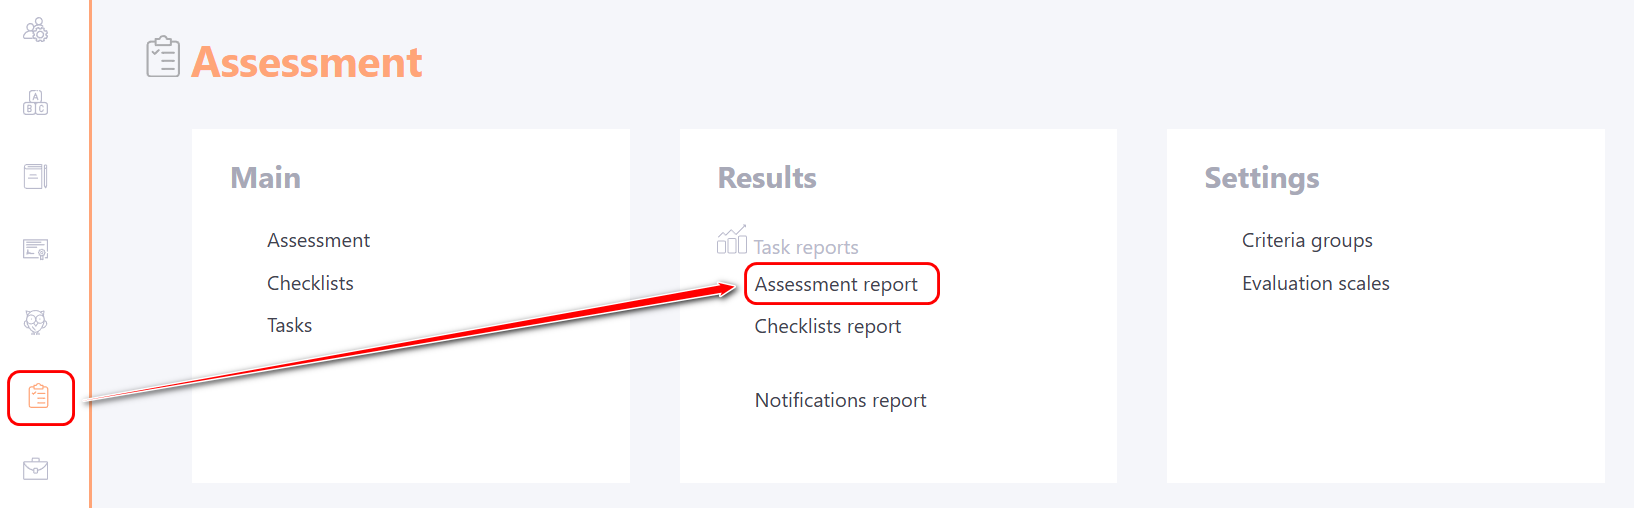
- Through the Assessment - Results - Assessment Report menu:
The following fields are displayed on the Assessment Report page:
(1) - filter for selecting the Assessment that is used in the specific Tasks;
(2) - filter for selecting the Task. Along with the task title, the date/time of creation and Id number are displayed;
(3) - button to clear the filters by assessment and tasks;
Fields (1) and (2) need to be filled in only if you access the report via the Assessment - Assessment Report menu.
When opening the report in other ways, the assessment title and task title are automatically selected.
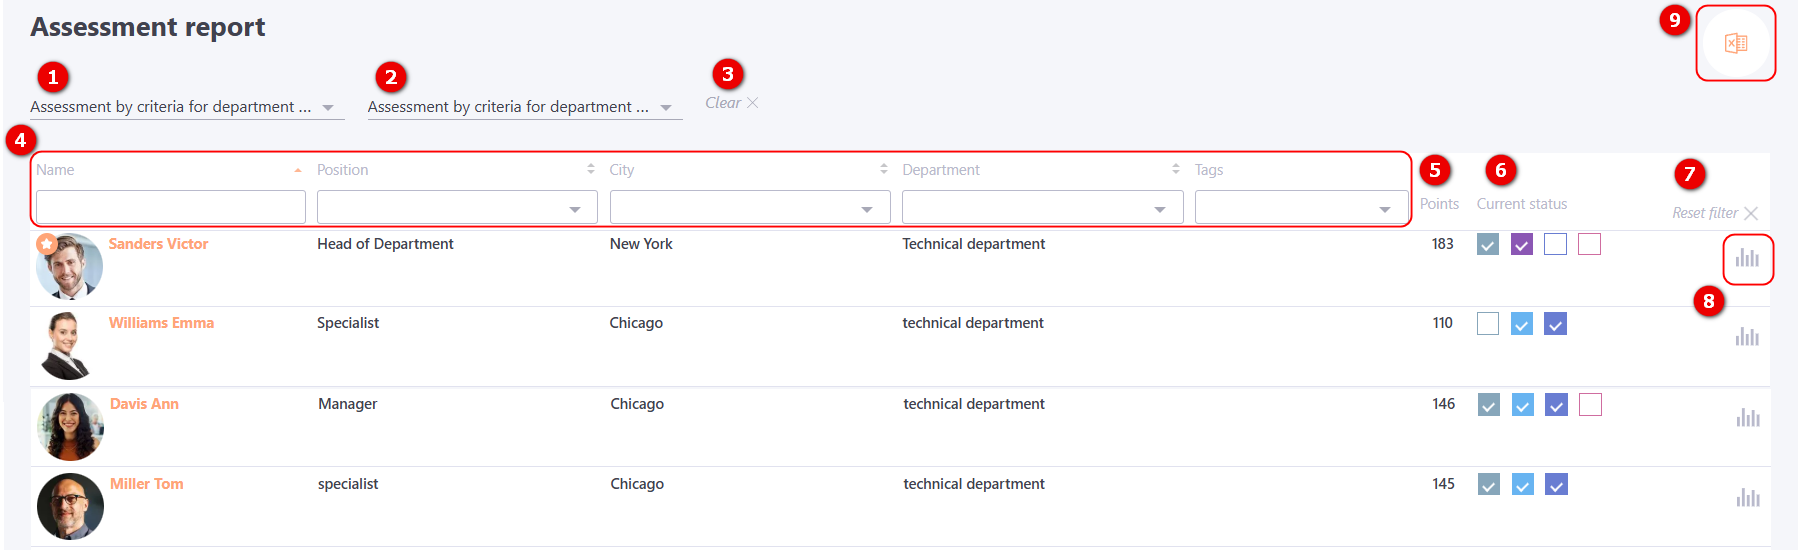
(4) - User data: Name, Position, City, Department, Tags. Filtering and sorting is possible by all parameters;;
(5) - the number of Points awarded a specific answer according to the selected Criteria evaluation scale;
(6) - the current status of completing the questionnaires;
(7) - button to Reset filter by users.
(8) - Report - button to go to a detailed report on the user.
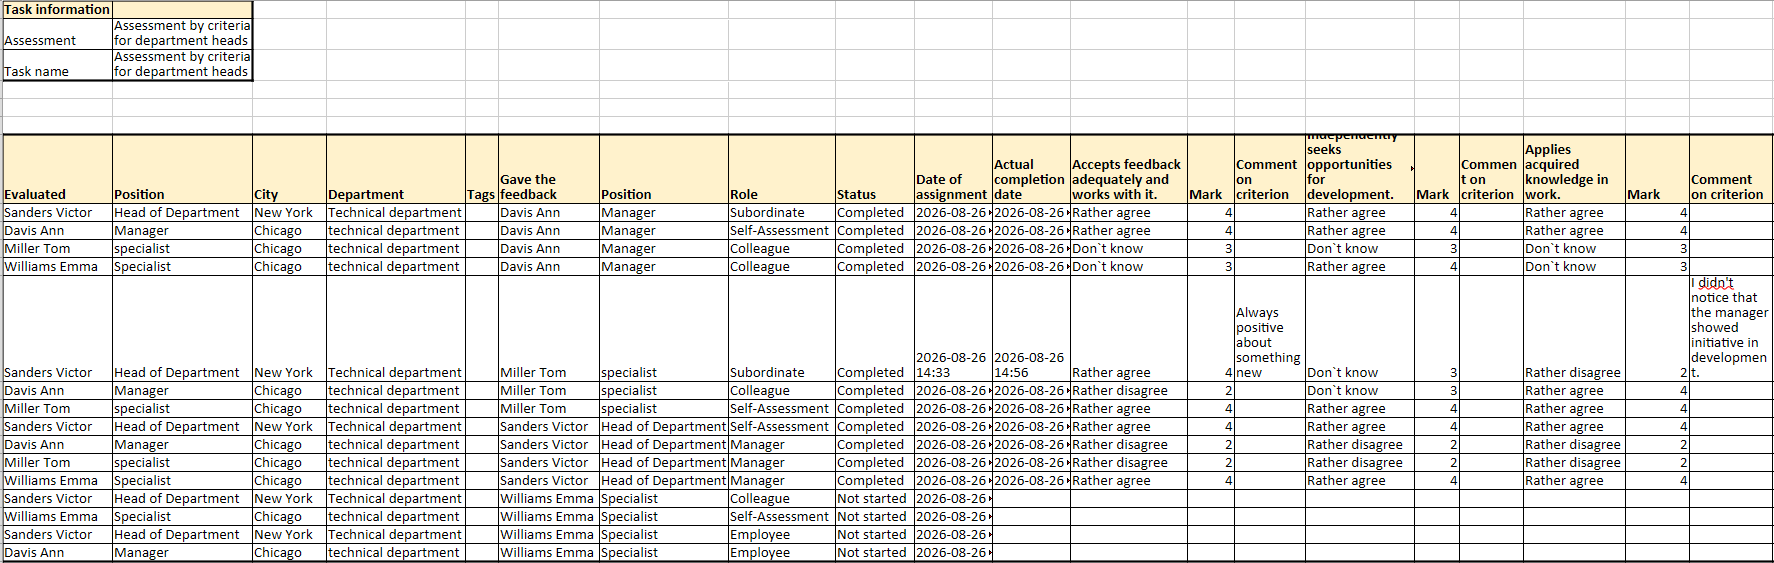
(9) - Export to Excel - button to upload all assigned questionnaires and the results of their completion to Excel.
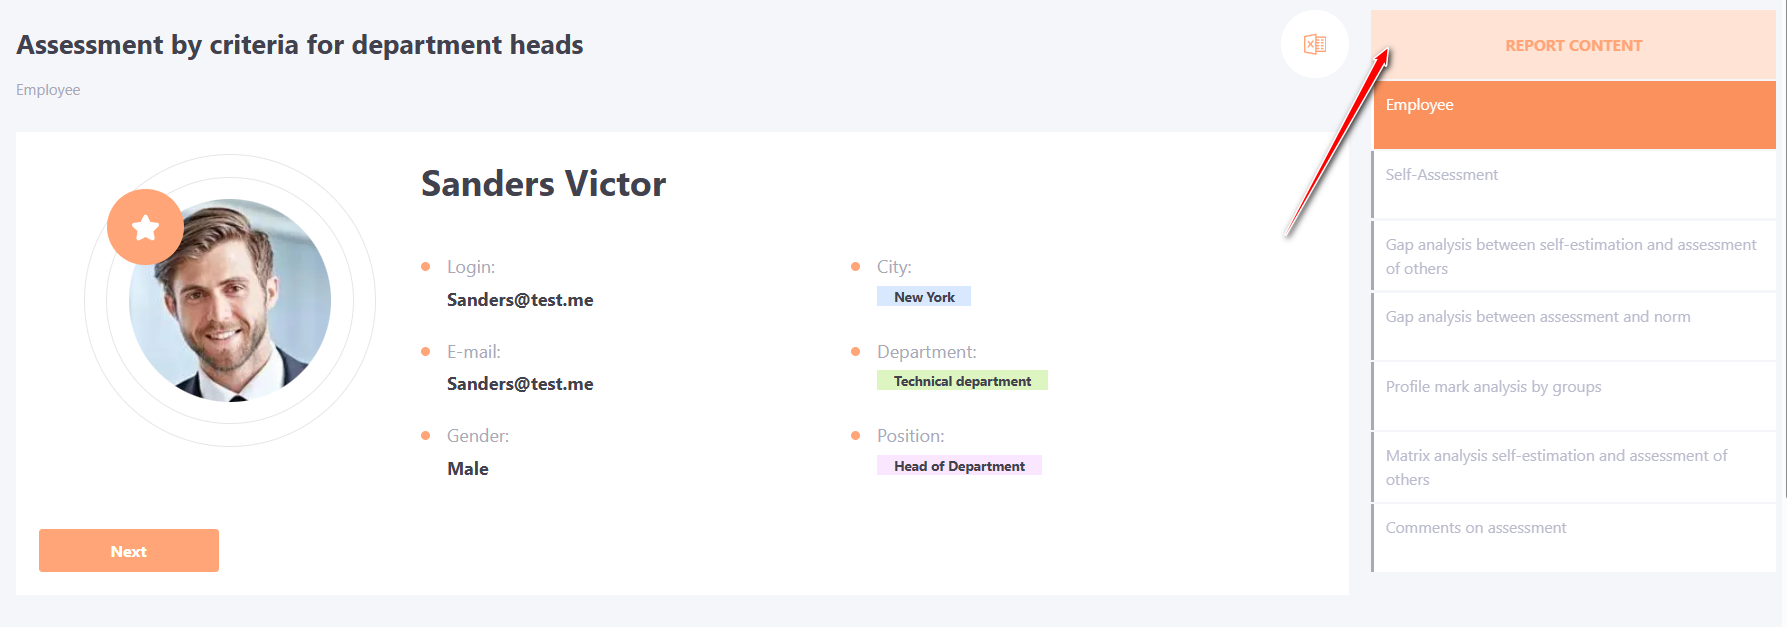
To view a detailed analysis of the assessment results by user, you need to click the Report (8) button opposite the desired employee.
The first page of the report displays general information about the employee, and on the right - the Report content - tabs with detailed types of analysis of the results.
Self-assessment
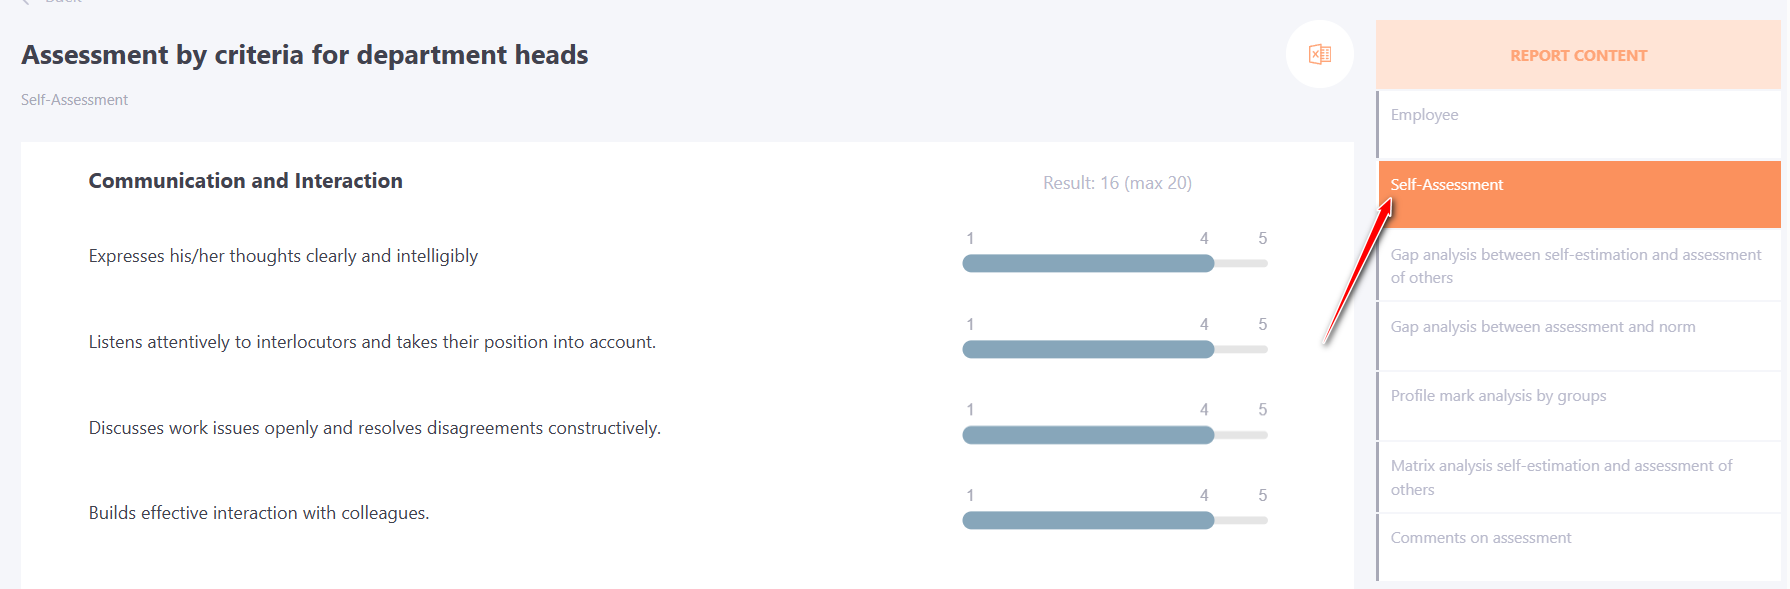
The second page contains an employee self-assessment report, which allows you to determine which qualities the employee considers to be his or her strengths and which are weaknesses. For each criterion, a scale with a score is displayed, and the overall result of the self-assessment for the group of criteria is displayed:
Gap analysis between self-estimation and assessment of others
Gap analysis between assessment and self-esteem is an analytical tool that clearly demonstrates how an employee's assessment by others differs from their own self-assessment.
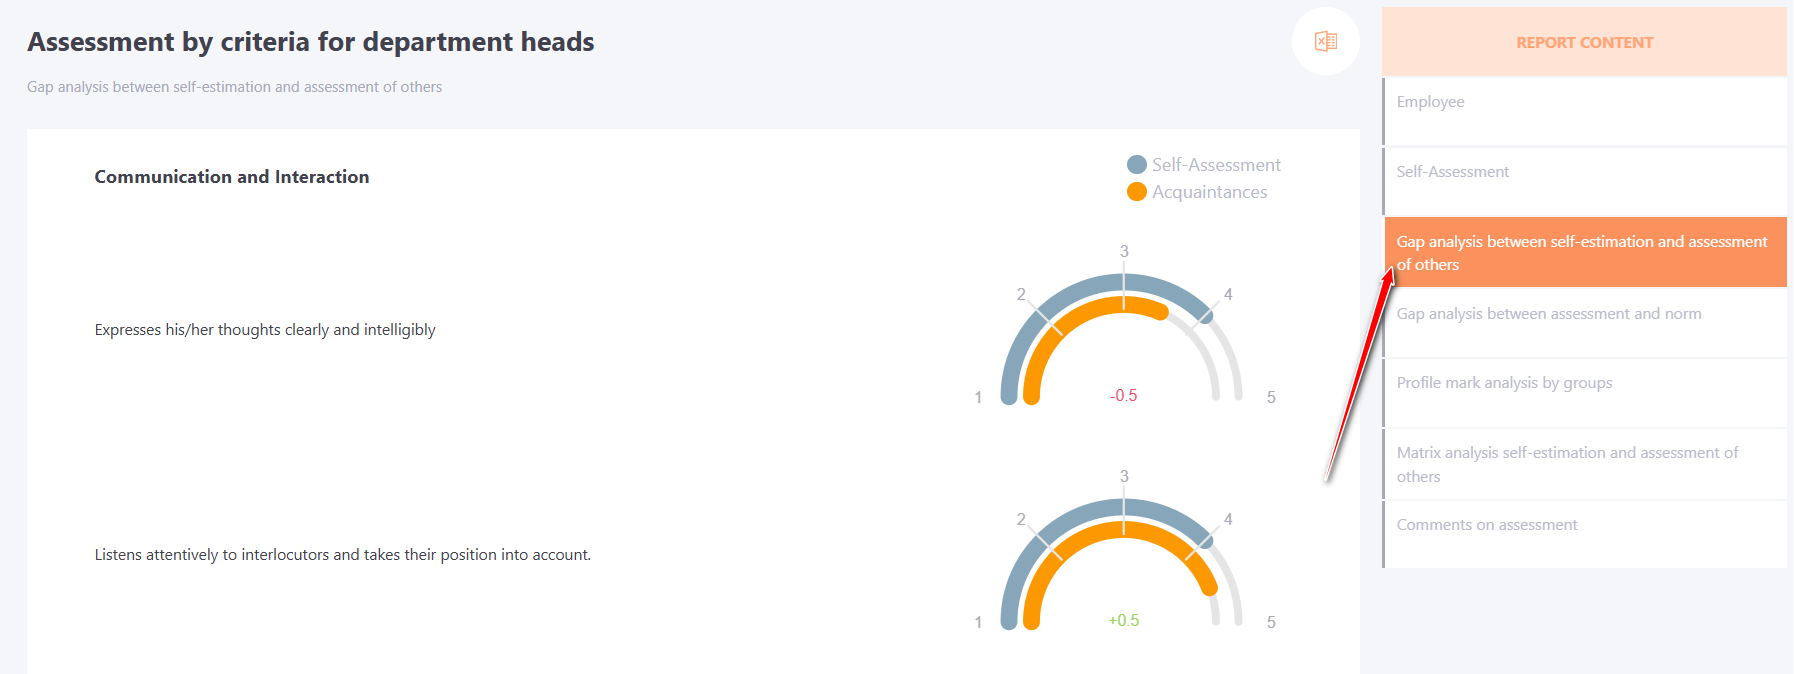
Please note that this type of graphical analysis reflects the general opinion of others, without dividing them into supervisors, subordinates, and colleagues.
On the one hand, this greatly simplifies the perception of the diagrams, but to understand how the Employee was evaluated by representatives of each of the groups of his environment (for example, colleagues or subordinates), you will need to refer to the following sections of the report.
The gap analysis between the assessment and self-assessment is displayed for each criterion separately.
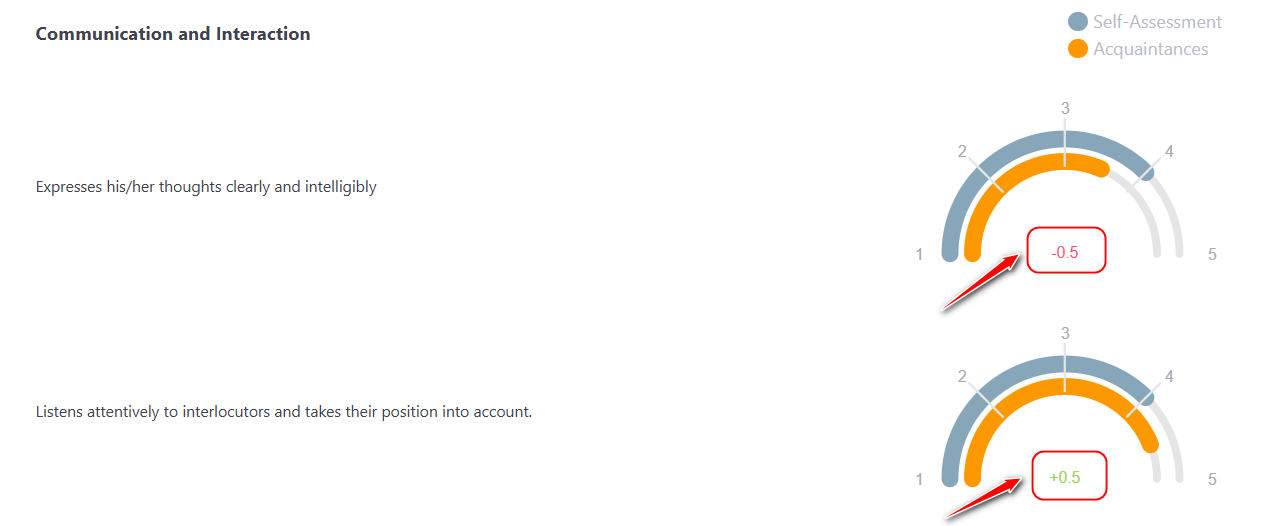
The "Difference" indicator is also calculated for each criterion. If the Employee has underestimated himself, i.e. the average assessment of others is higher than the self-assessment, the difference is displayed as a green plus sign, and if others assessed him on average lower than he assessed himself, the value will be negative and highlighted in red.
Gap analysis between assessment and norm
This section of the analytical part of the report includes two types of diagrams. Each of the core criteria is analyzed in two types of diagrams.
The first diagram shows the gap between the overall score of each employee criteria 1 and the norm 2.
1 In this case, the total score is calculated as the average of the scores of all respondents, including the Employee's own score.
2 The norm can be either the average value for the company or the wishes of the company's management regarding the standards that employees should meet.
The graph shows the average score for each of their criterion in orange with a signature of its value, the norm as the green line, and a signature of the gap value, negative or positive.
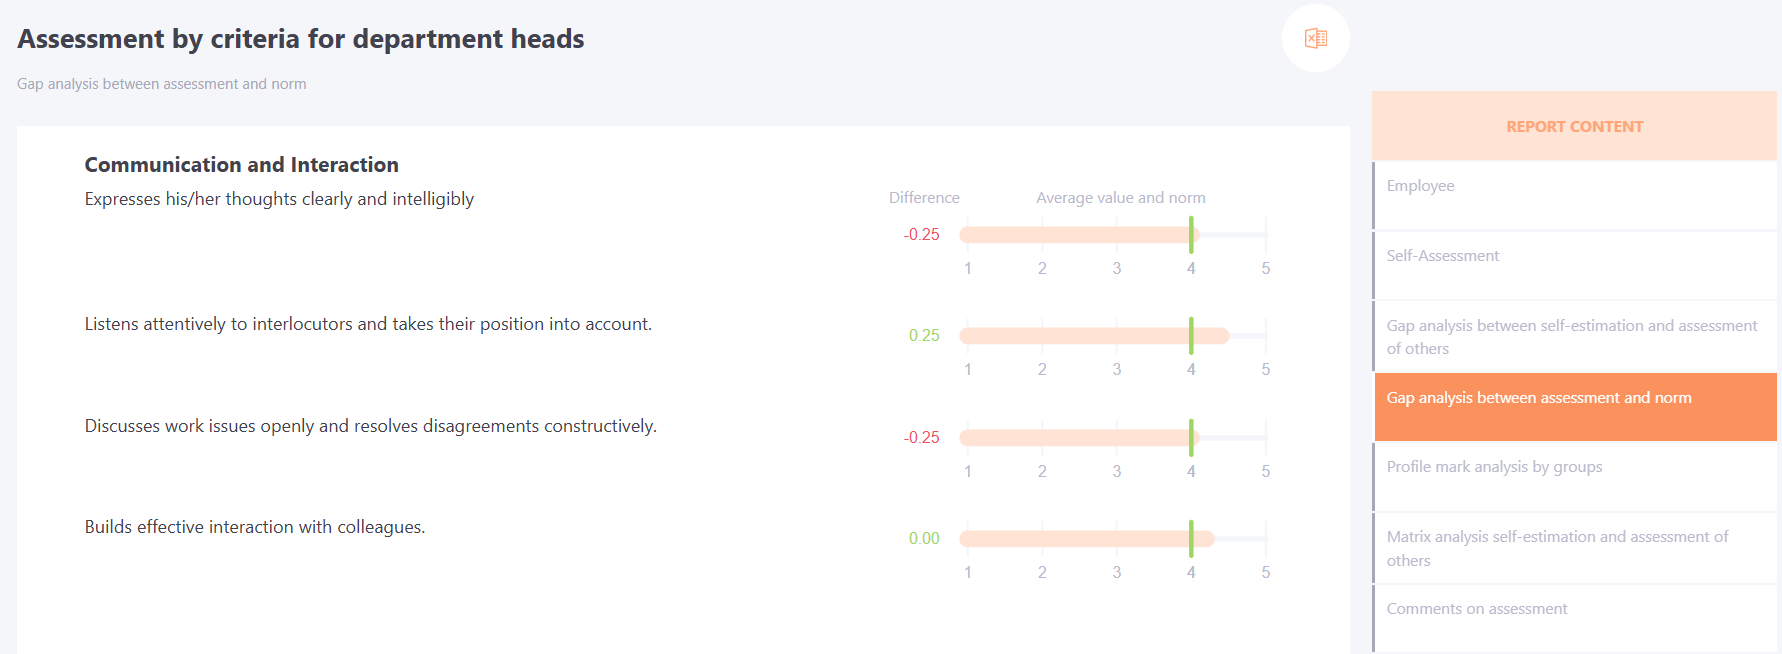
A negative gap means lagging behind the norm. From this diagram, you can draw a conclusion about which aspects of the Employee lags behind the requirements to the greatest extent. Don't be alarmed if the majority of gaps are negative: the norm should be high. Your task is to see the most severe deviations.
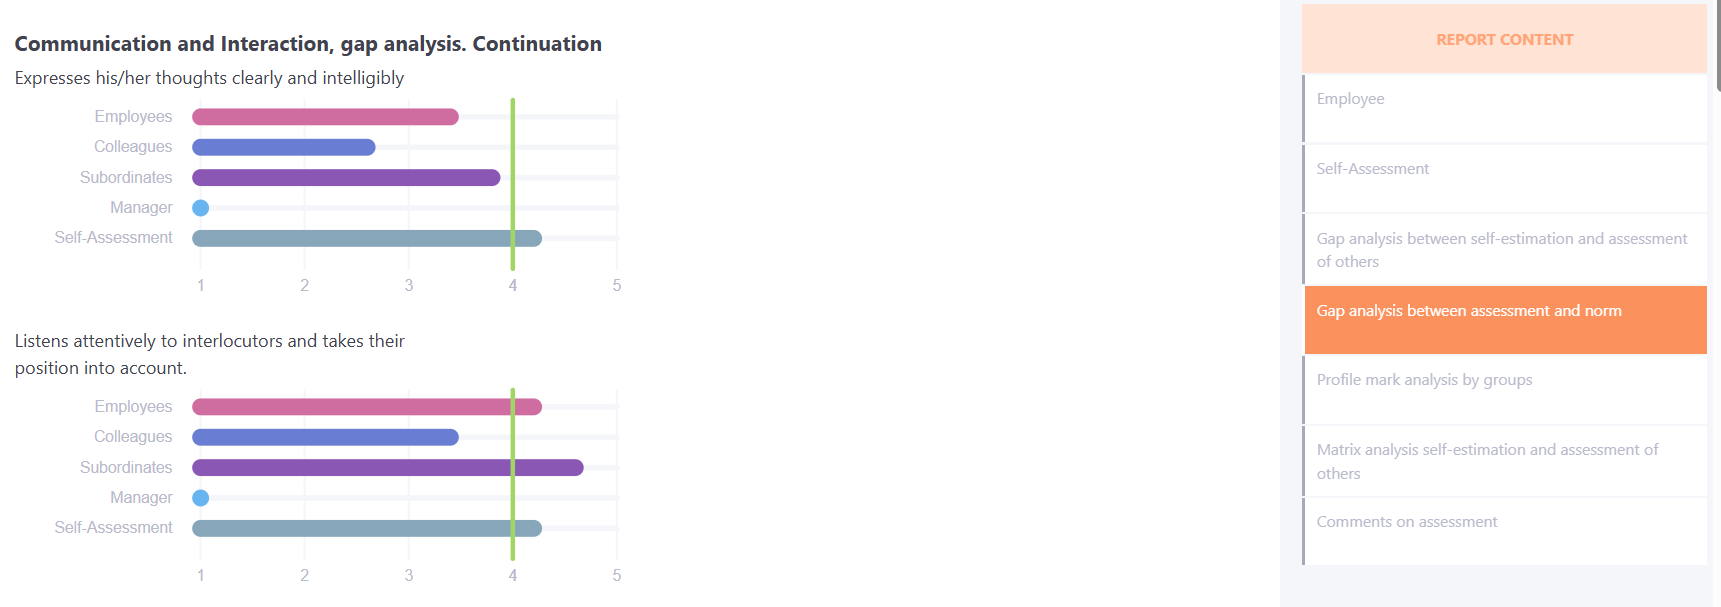
The second part contains several bar graphs, each of which compares in detail the assessment of each group of respondents, the Employee's self-esteem and the norm for this criterion.
The main advantages of analyzing the gap between the assessment and the norm:
- You will identify the main weaknesses of the Employee that should be worked on first.
- You will find out in which criteria the Employee underestimates themselves, and in which, on the contrary, overestimates.
- Now you always have access to information about the preferences of the management regarding the professional qualities (norm) of the Employee.
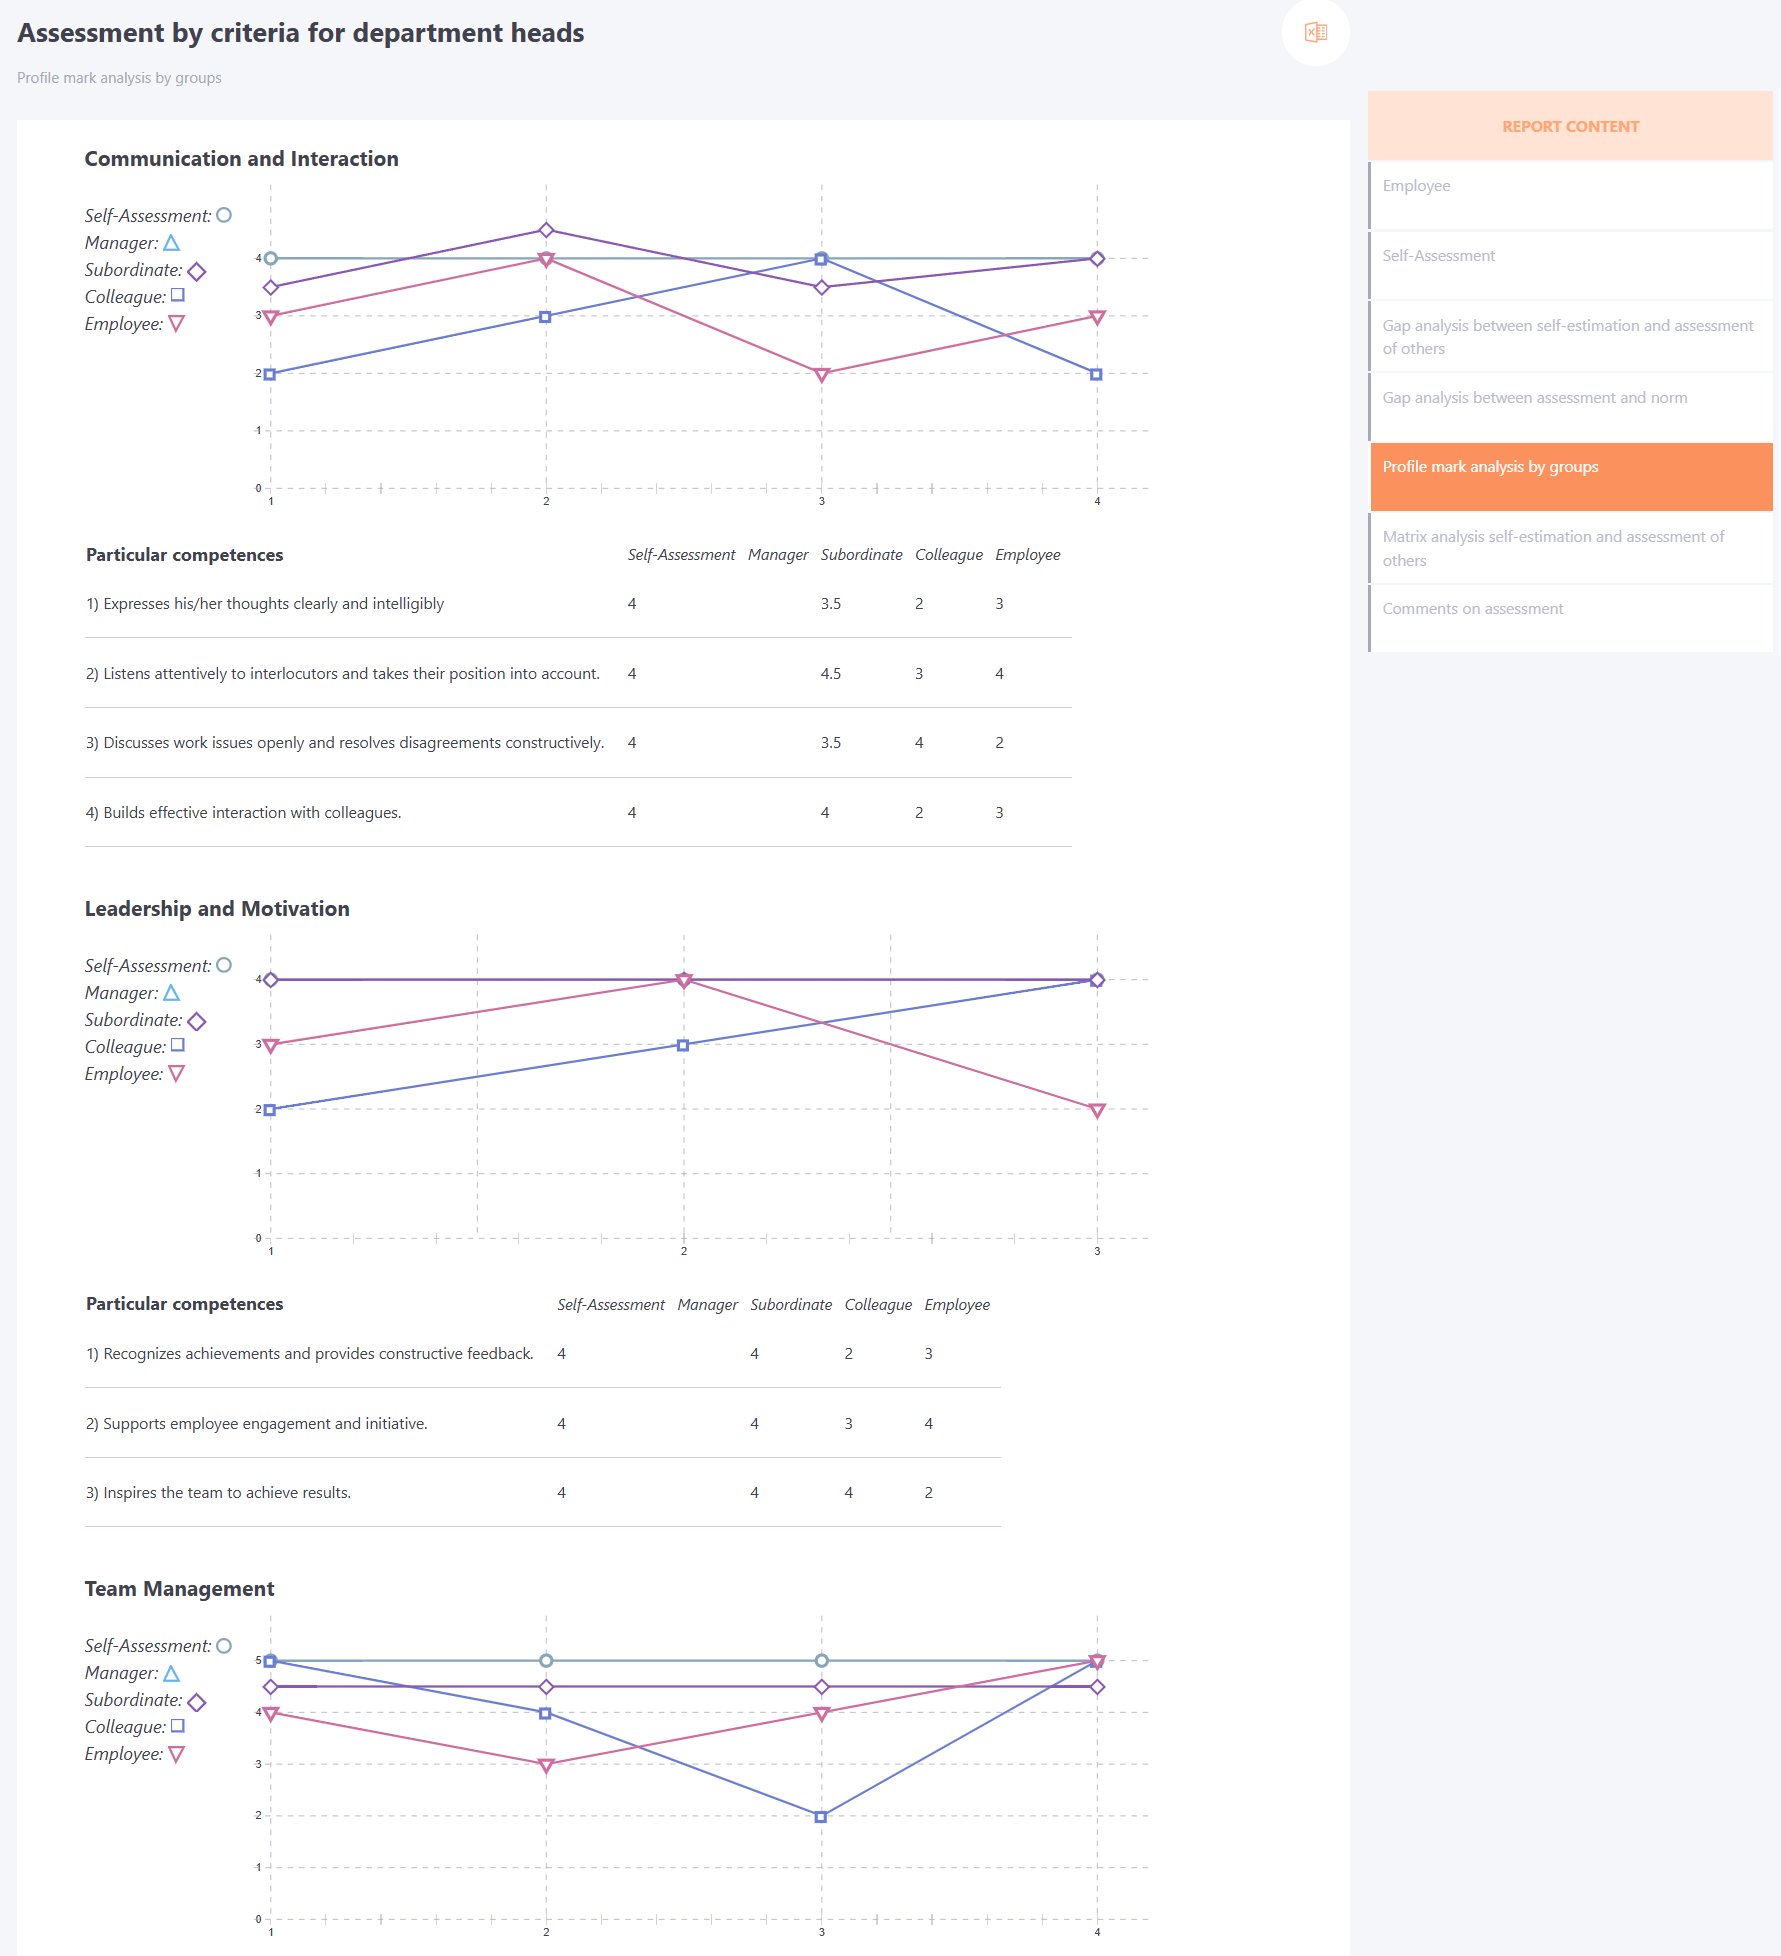
Profile mark analysis by groups
This analysis involves building a visual "profile" of the employee in terms of each of the criteria.
Profile analysis is the most convenient way to find out for each core criteria whether the Employee's self-esteem is lower than the assessment of any of the groups, which group, by how much and in how many criteria.
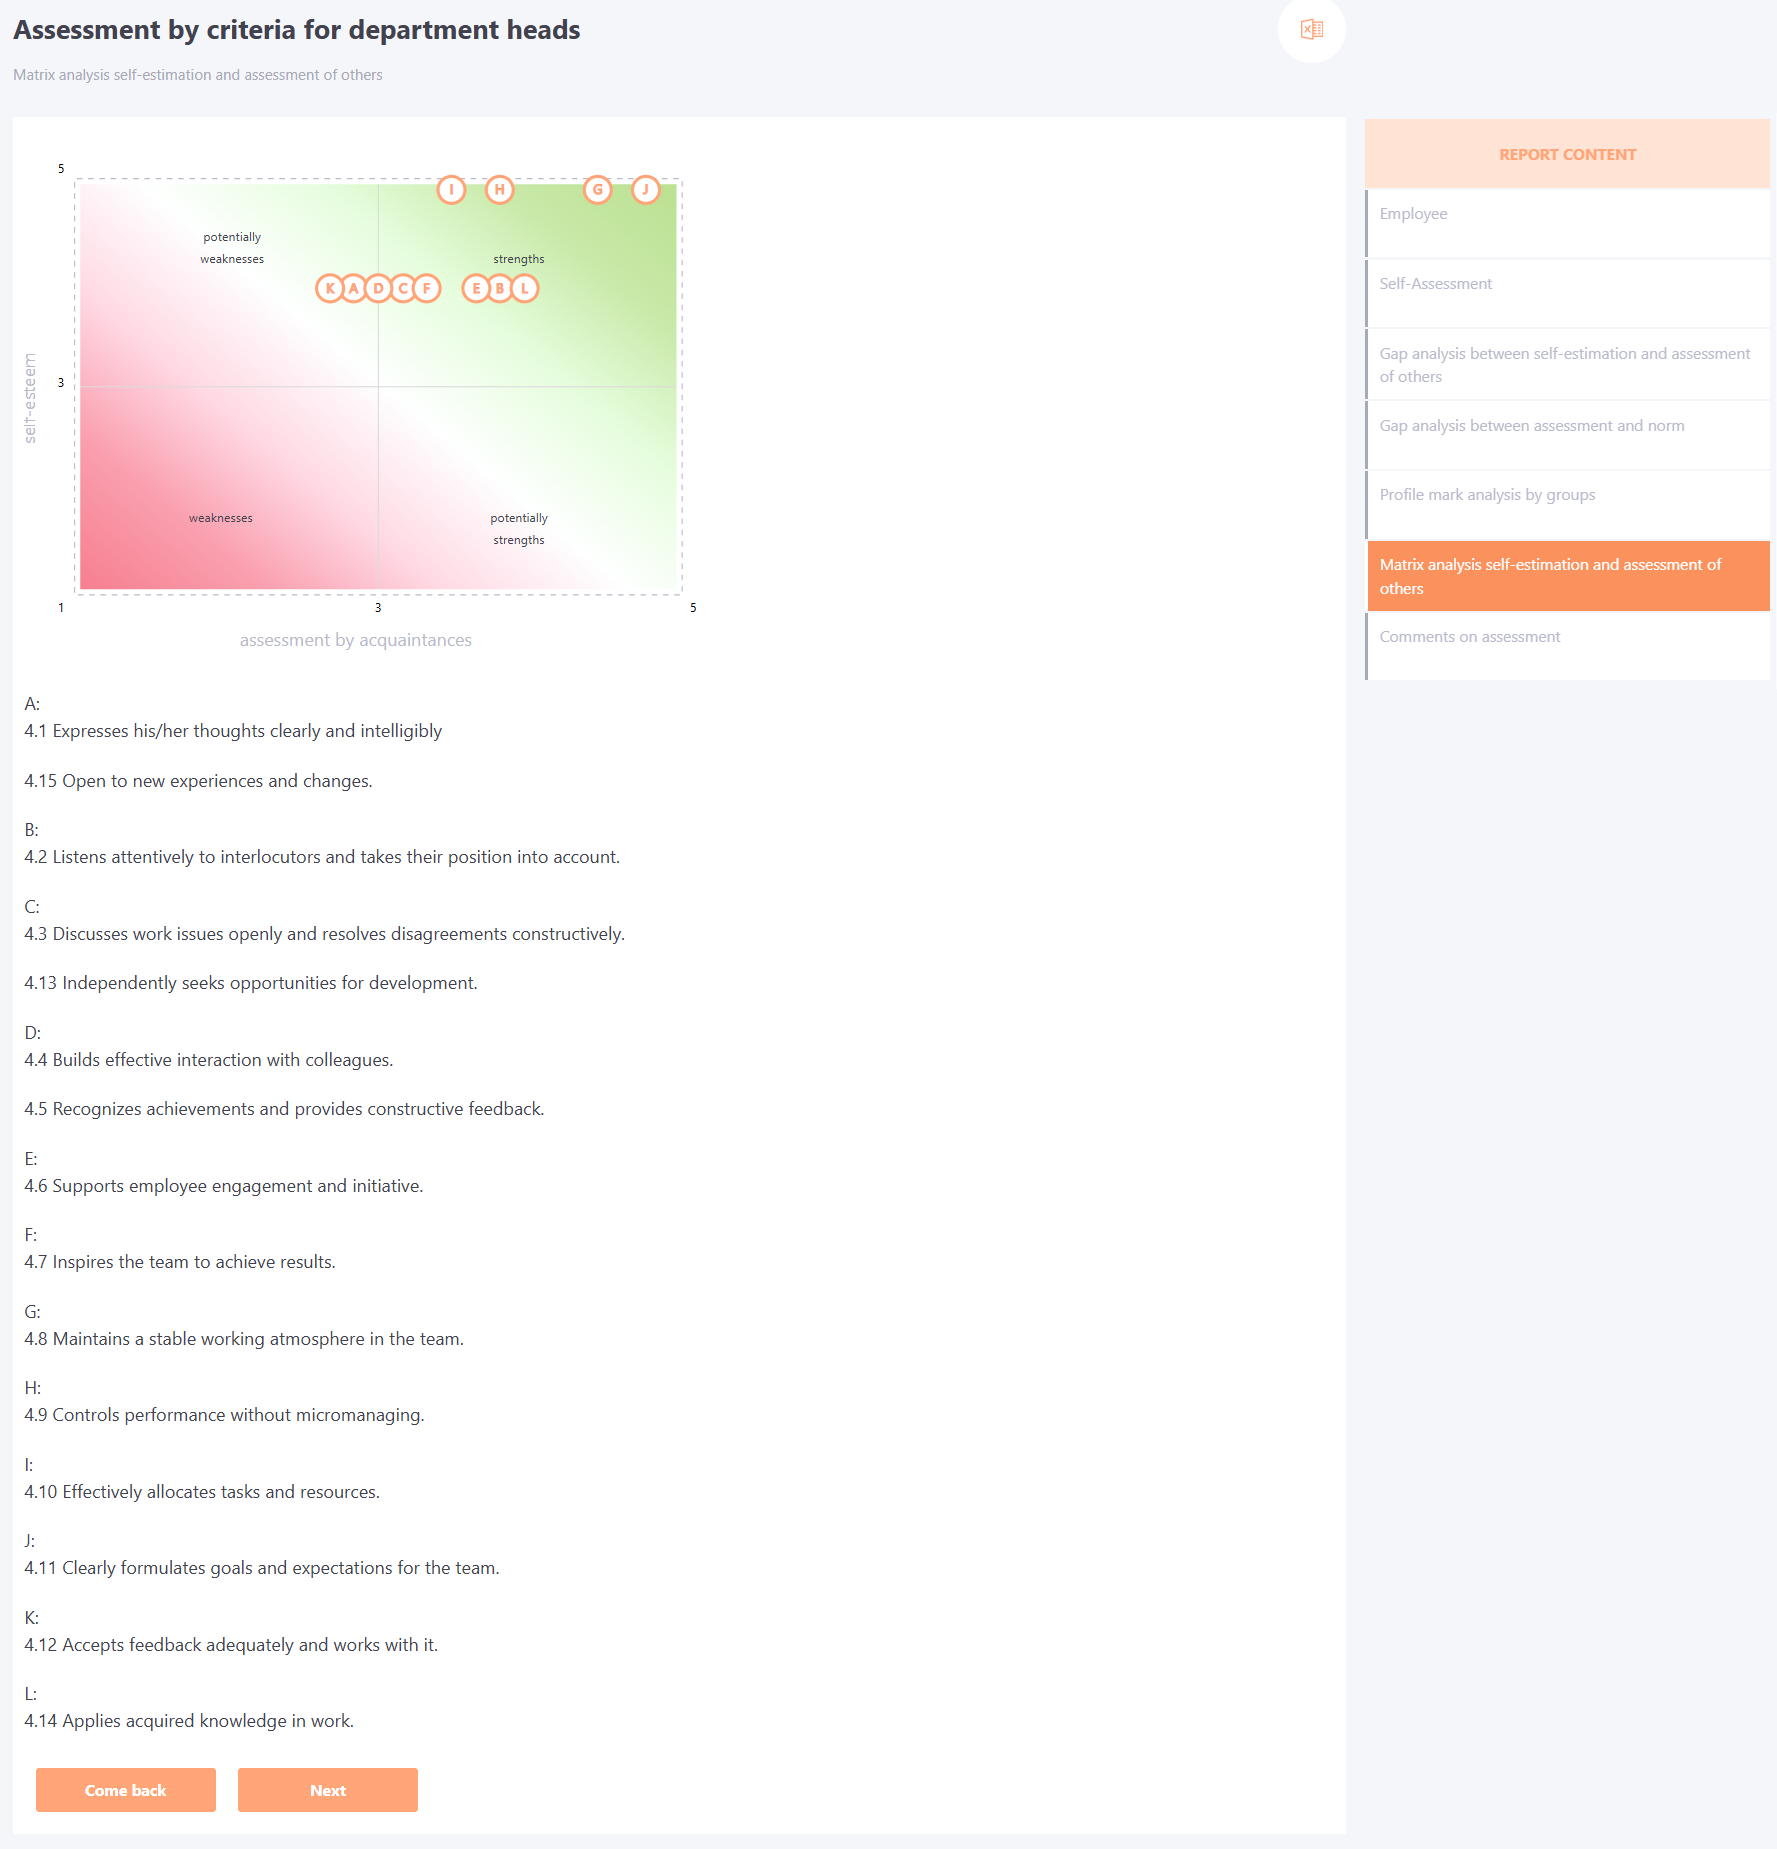
Matrix analysis self-estimation and assessment of others
In this case, we consider a pair of values of assessment—self-esteem for each criteria. The assessment here refers to the arithmetic mean of the assessments of all survey participants, except for the Employee's own self-esteem.
The matrix is quite easy to use. The point is that each dot represents one of the Employee's criteria. And in this case, what matters is which cell of the matrix the dot is in.
It is considered that the upper right quarter of the matrix contains those strengths of employees that are known to them and their colleagues. It is recommended to support them, but attention should be paid to other criteria groups first.
In the bottom left, the known weaknesses of the Employee are indicated. Should they be addressed? It all depends on the standard for each of these criteria dictated by their management, and how far the Employee falls short of it. In order to set priorities when working with this matrix, you will have to constantly refer to Gap analysis between assessment and norm).
Pay special attention to the criteria in the upper left quadrant. These are weaknesses (according to others) that the Employee does not recognize as such. The Employee should focus the majority of their attention on them when working on their professional effectiveness. Perhaps others have misunderstood something, perhaps they have made a mistake in giving him low marks for these criteria. But these people highly appreciated their other qualities, so they are capable of making an objective assessment.
Even if they are wrong, the Employee must understand that it is their perception, the way they see them. Since they will continue to work with them, it is they who must be convinced of their professional capabilities. If nothing else, they should work on these criteria.
The last quadrant is the bottom right. It contains the criteria that others have rated the Employee much higher than the Employee themselves. The criteria in this quadrant are the Employee's strengths that the Employee did not take into account, but were nevertheless noticed by their environment. Unfortunately, not all strengths unknown to the Employee can be noticed by other people at all. But those criteria that are visible in this cell are their resource, often a very valuable one, which they could use, but do not know about. Now the Employee can start to get additional efficiency from their abilities.
The main advantages of matrix analysis:
- The discrepancy between self-esteem and the assessments of others is clearly illustrated;
- In combination with Gap analysis between assessment and norm matrix analysis allows you to prioritize the Employee, determining which criteria to start working on first.
Comments on assessment
Often when evaluating an employee, it is important not only to see the rating, but also to understand what it is based on. To do this, when creating an assessment in the Assessment Settings you need to enable the ability to add comments to the Criteria Group and individual criterias.
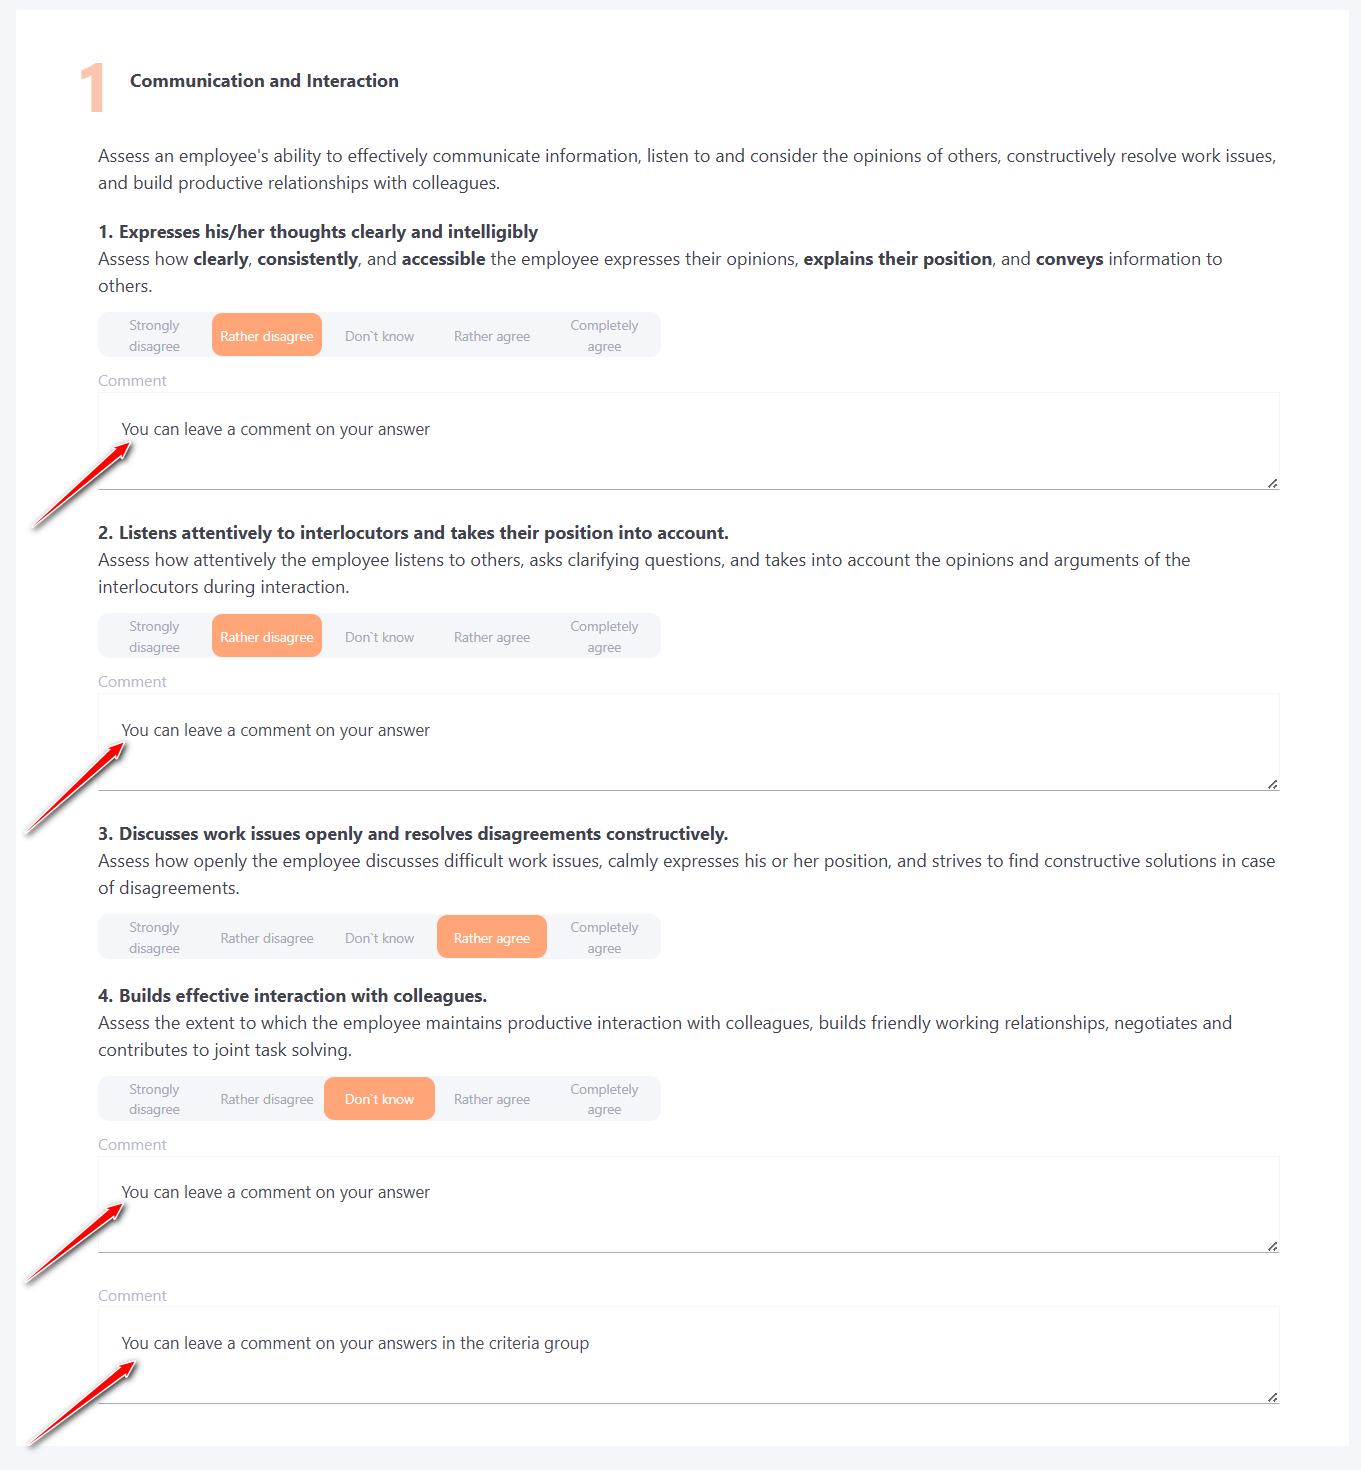
If a user leaves comments during an assessment, they are displayed in the report in the Comments on assessment block. They can be seen by the administrator who has access to assessment reports and, if this feature is enabled, by the manager and the employee being assessed.
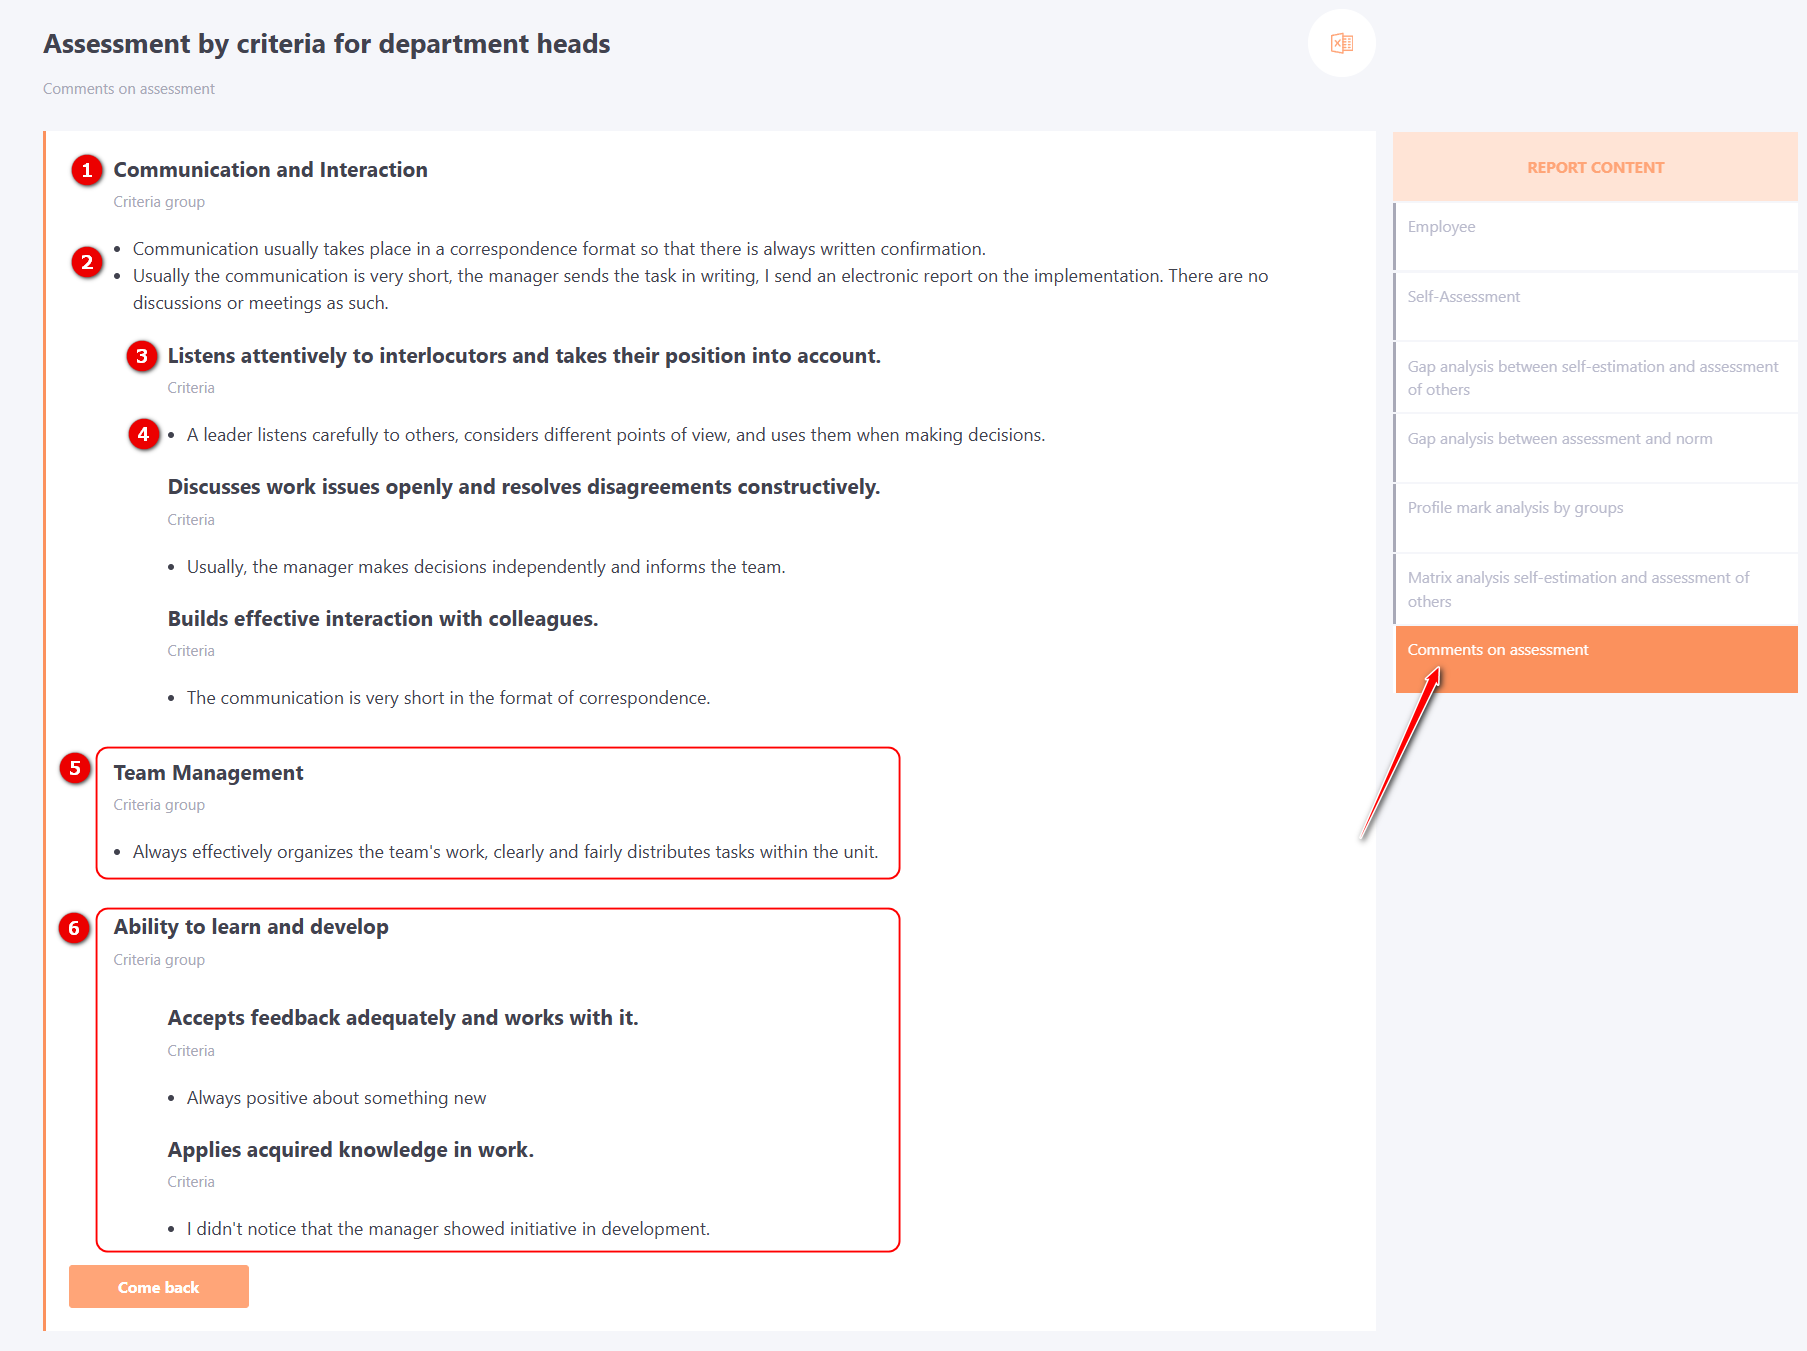
Comments in the report are displayed in the order of the questions in the assessment.
First, the title of the Criteria Group (1) is displayed , and below it, the comments left for the all group (2). Then, with an indentation on the left, the title of the criteria (3) for which the user left comments are displayed, and under each criterion, the corresponding comments (4).
If there is a comment for the Criteria Group, but there are no comments for individual criteria (5), only the group with its comment is displayed. In this case, the criteria are not displayed.
If there are no comments for the Criteria Group, but there are comments for its criteria (6), the group title is still displayed so that it is clear to which group the criteria belong.
If users did not leave comments during the evaluation, a corresponding message is displayed.

Export the Assessment report to Excel
For convenient viewing, you can export the report by assessment by criteria to Excel. To do this, open the User Report and click the Export to Excel button.
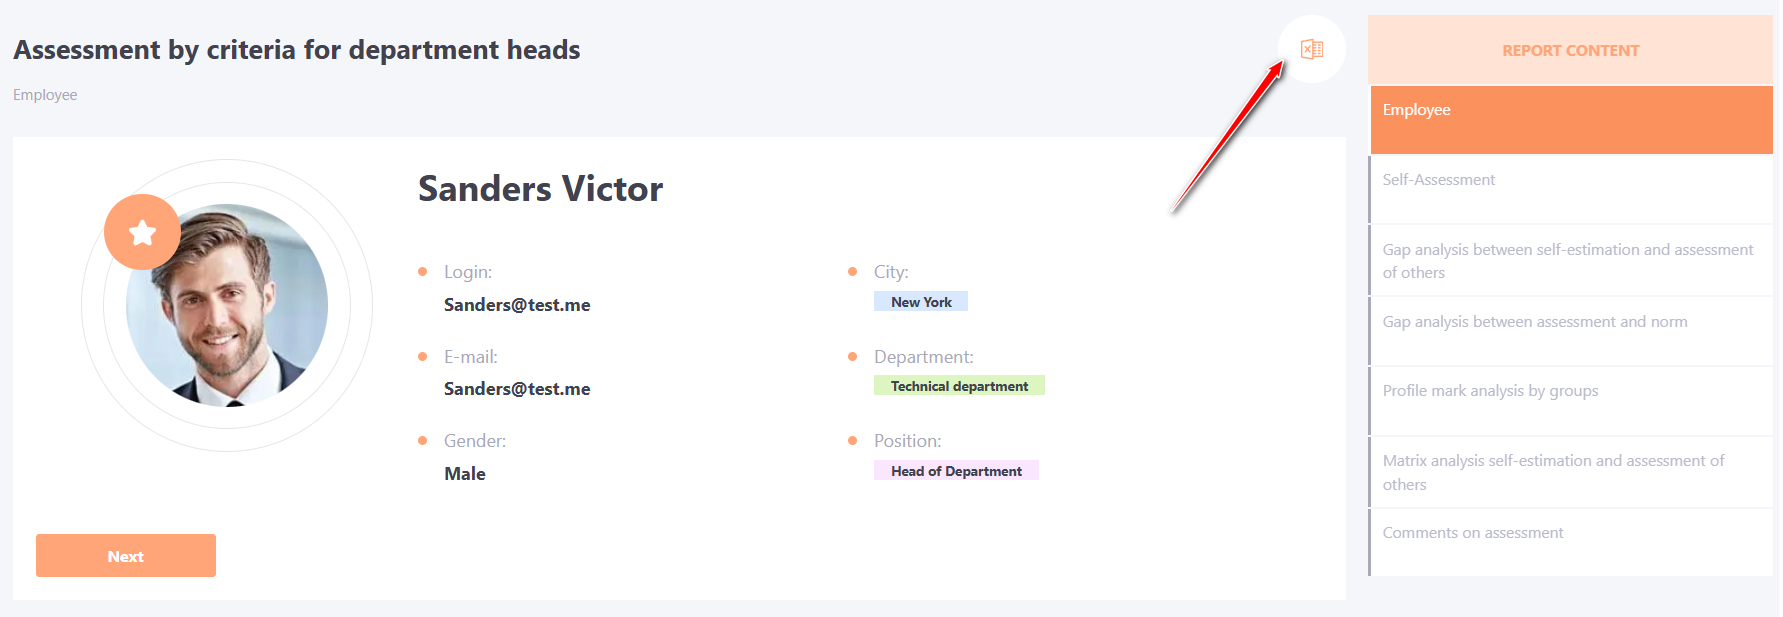
All data from the report is exported to Excel, and the results of each analysis method are displayed on a separate sheet.
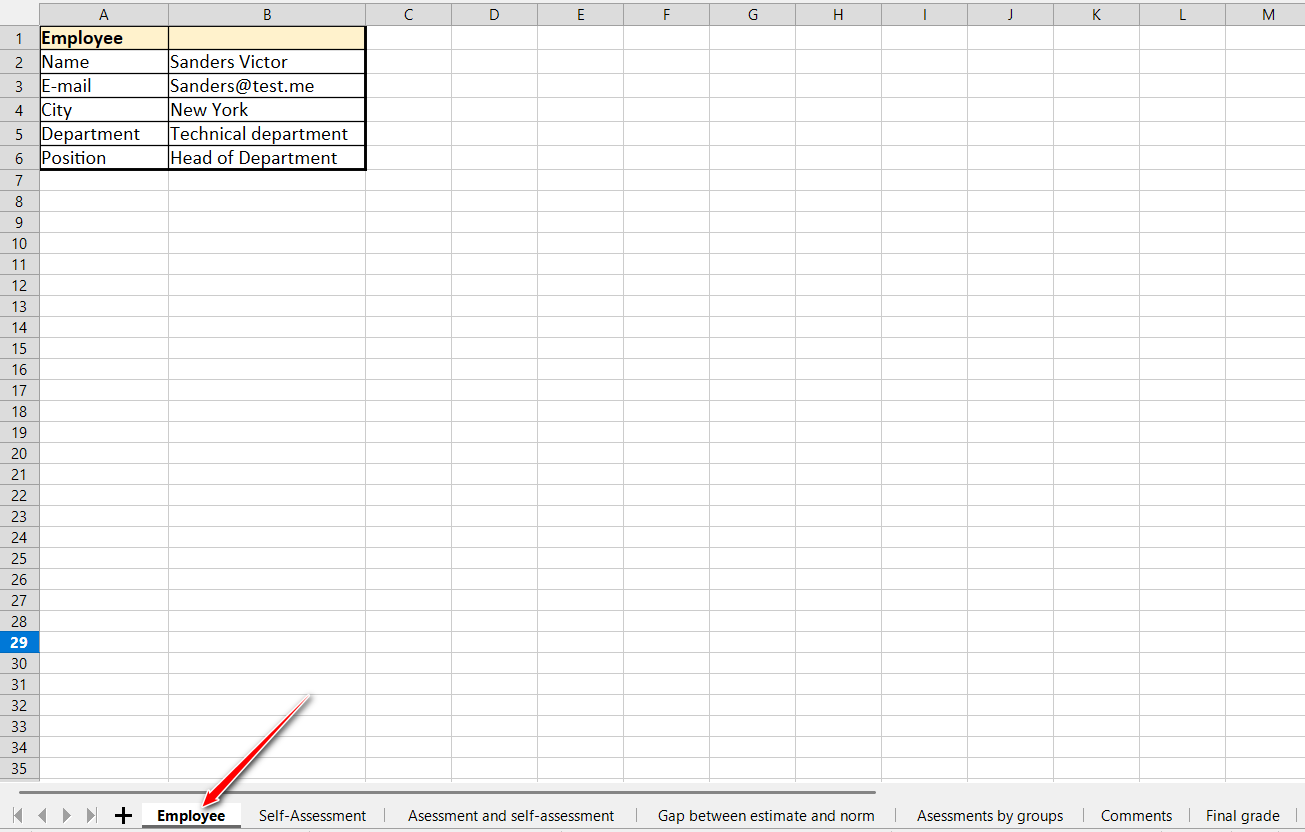
The Employee sheet displays basic information about the user who was evaluated.
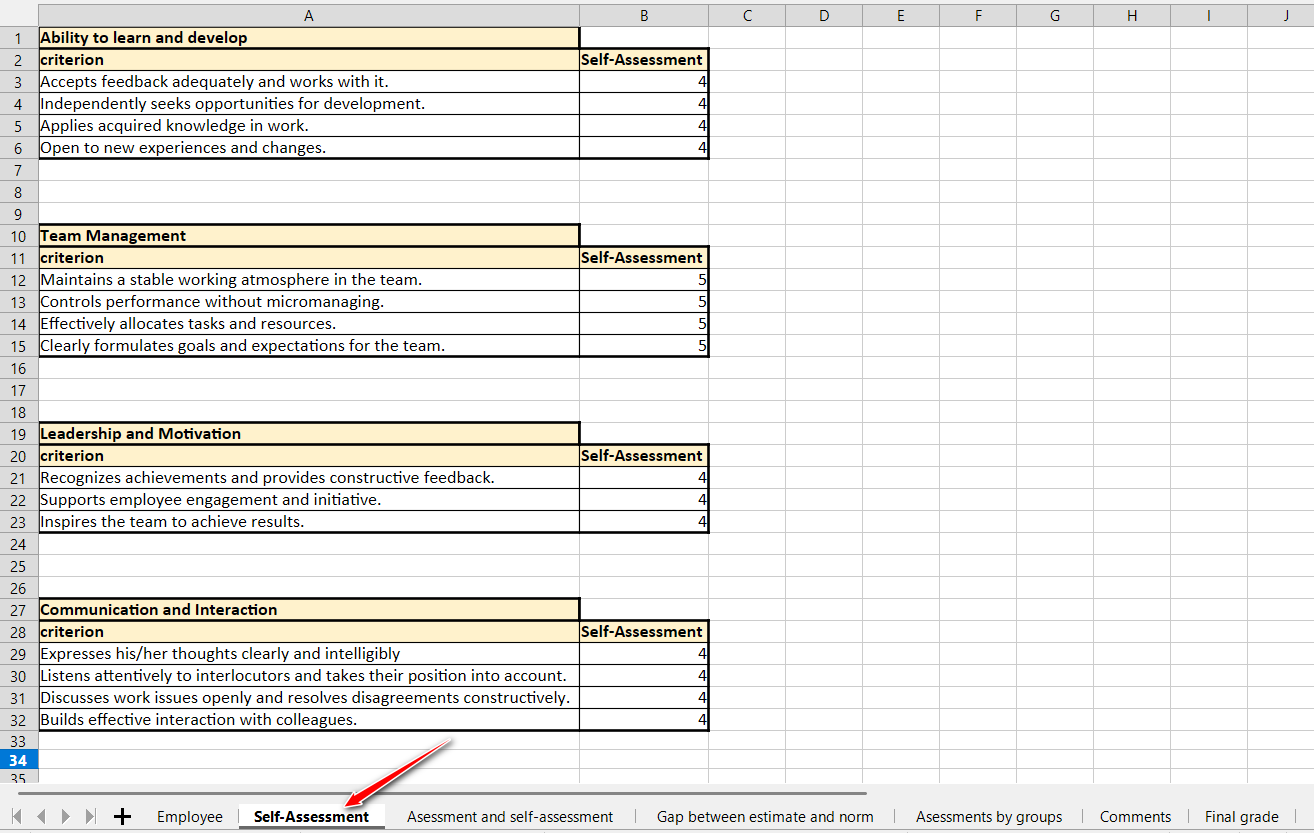
The Self-Assessment sheet displays the results of the self-assessment - the scores and answers that the user provided when assessing themselves.
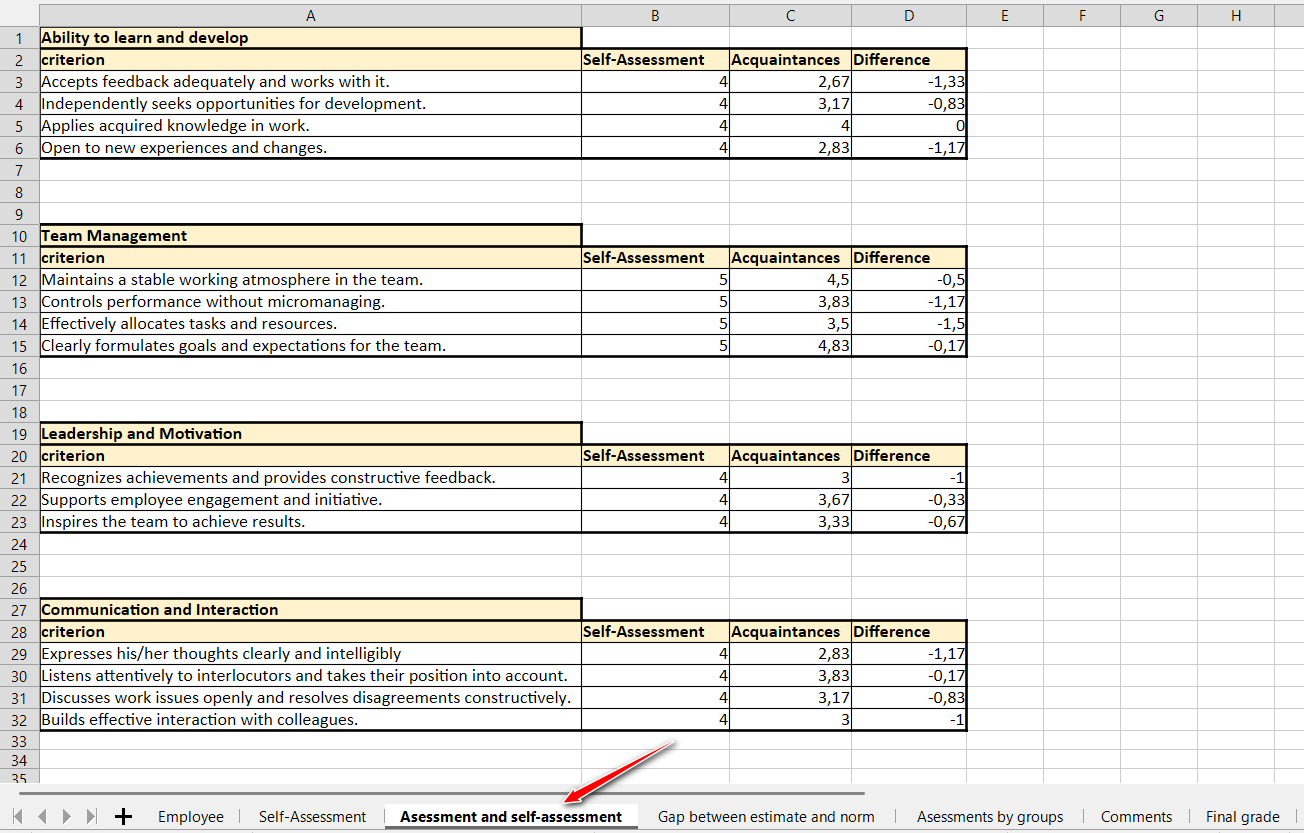
The Assessment and Self-Assessment sheet displays the results of the self-assessment, the average assessment result from other users (environment), and the difference between these results.
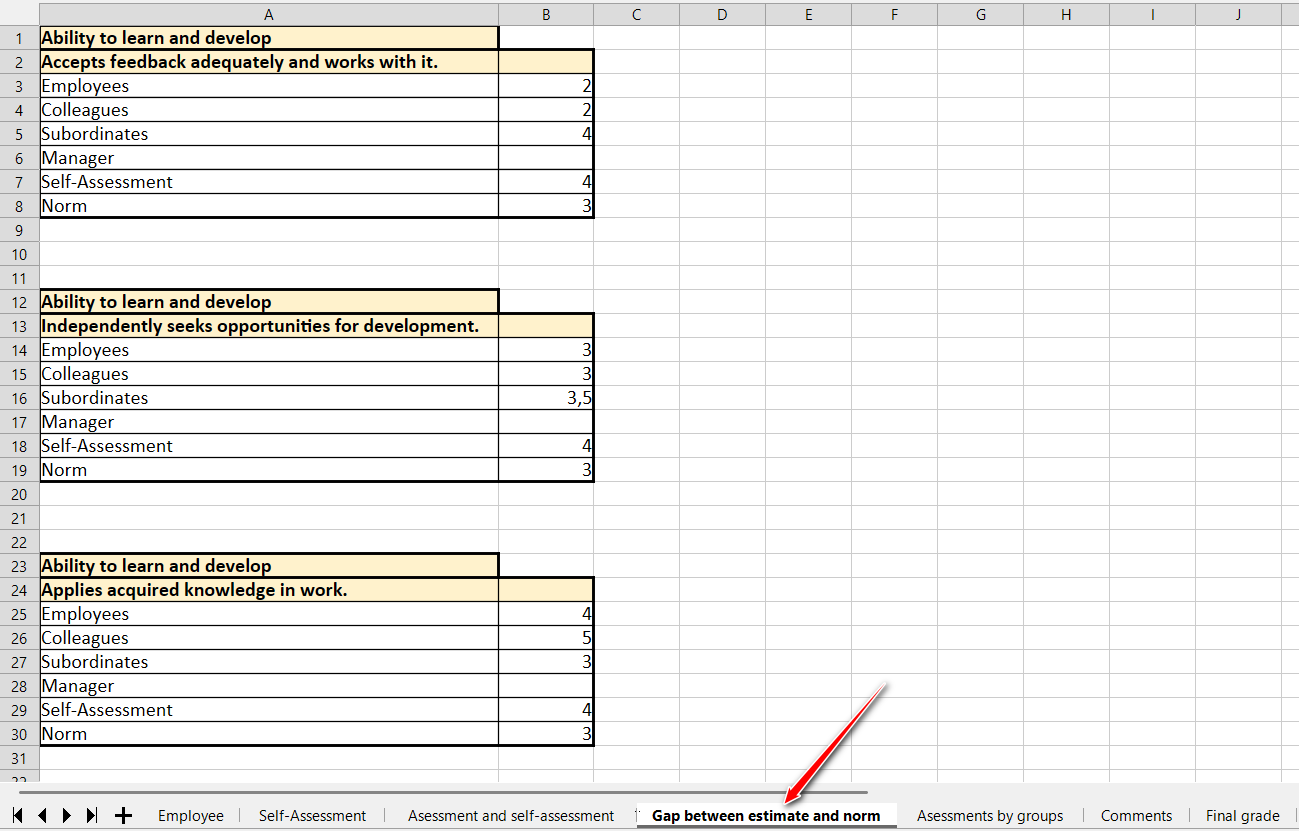
The Gap between estimate and norm sheet displays the average scores of individual groups of respondents (subordinates, colleagues, employees), the result of the self-assessment, and the established norm value for each criterion.
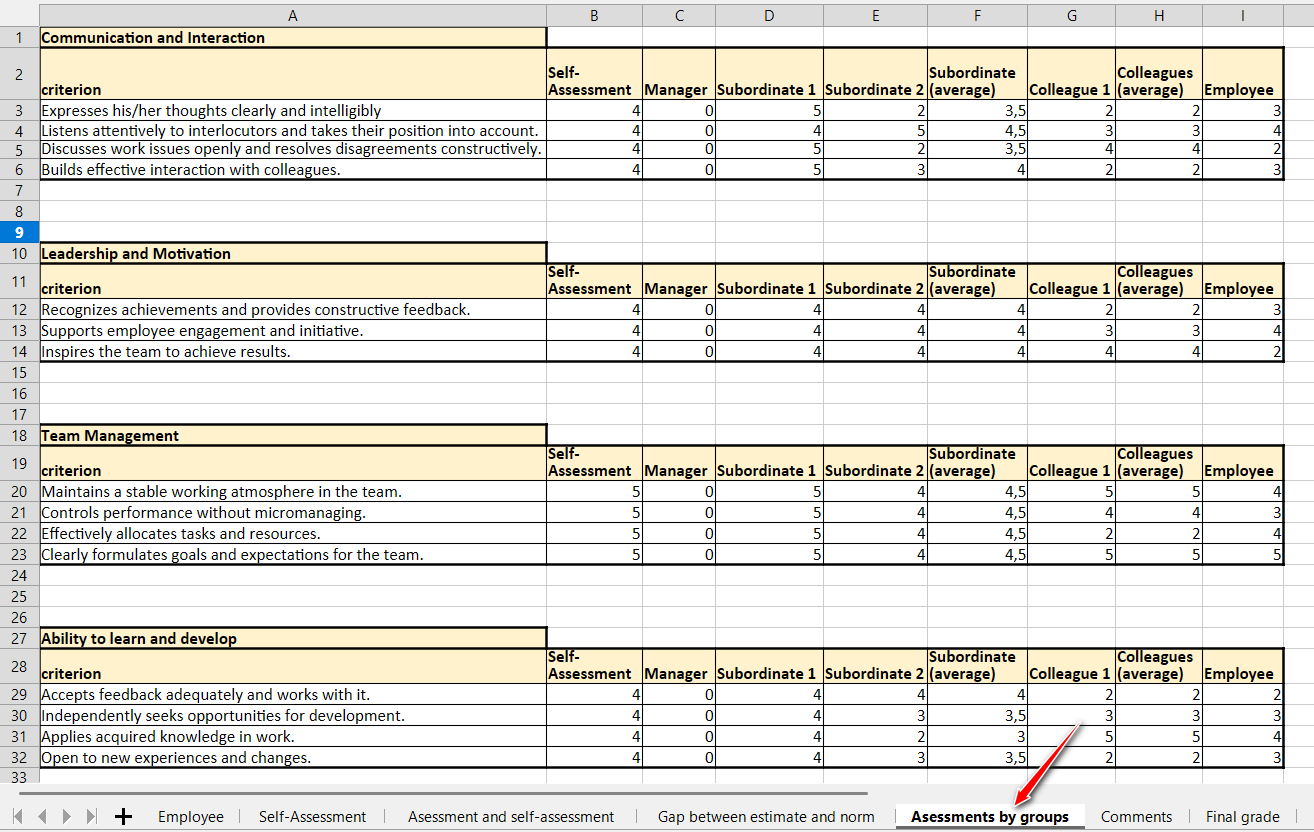
The Assessment by groups sheet displays the individual scores of all respondents for each criterion, as well as the average scores for each group of surveyed users.
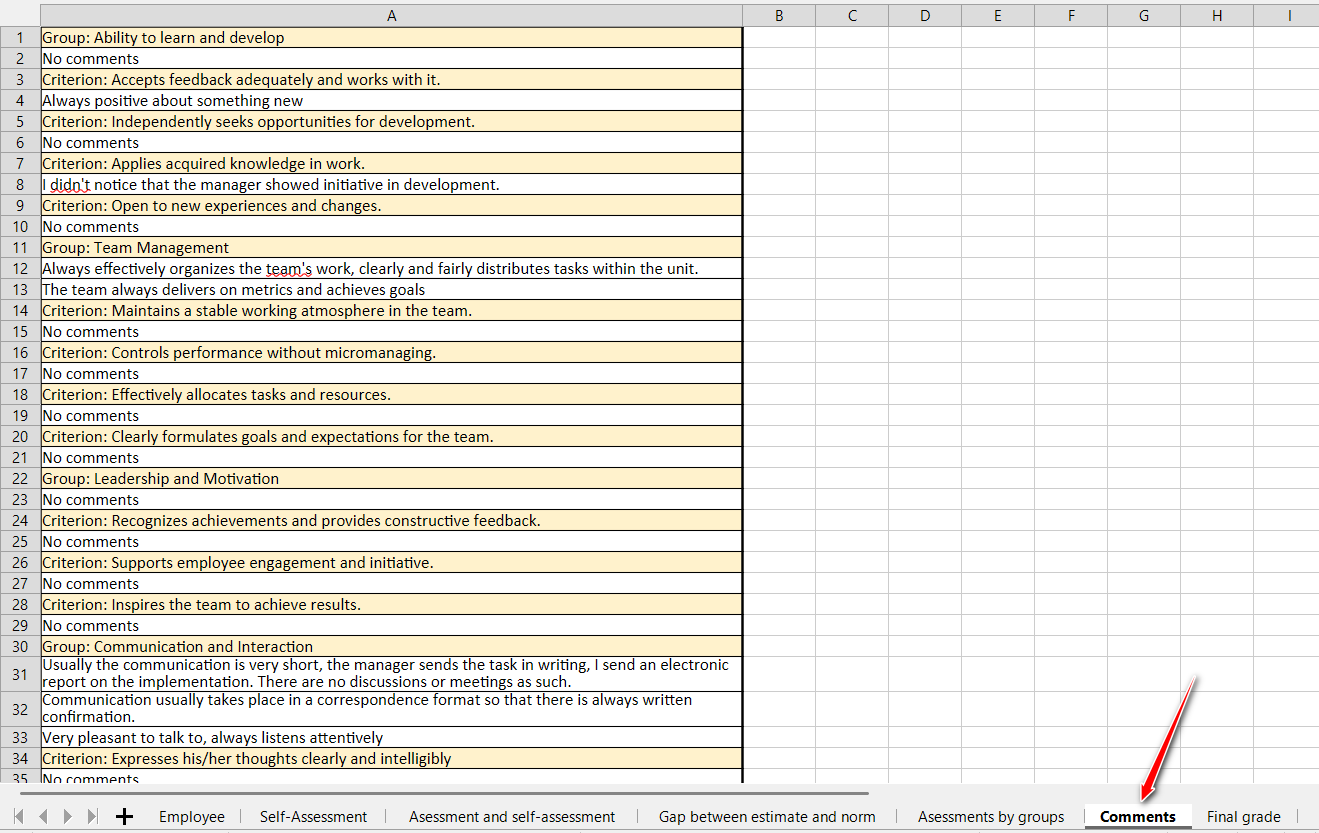
The Comments sheet displays all comments left by users during the assessment. First, the title of the Criteria Group is listed, followed by all comments left for that group. Next, the title of the criterion and the comments left for it are displayed.
Manager viewing of assessment by criteria report
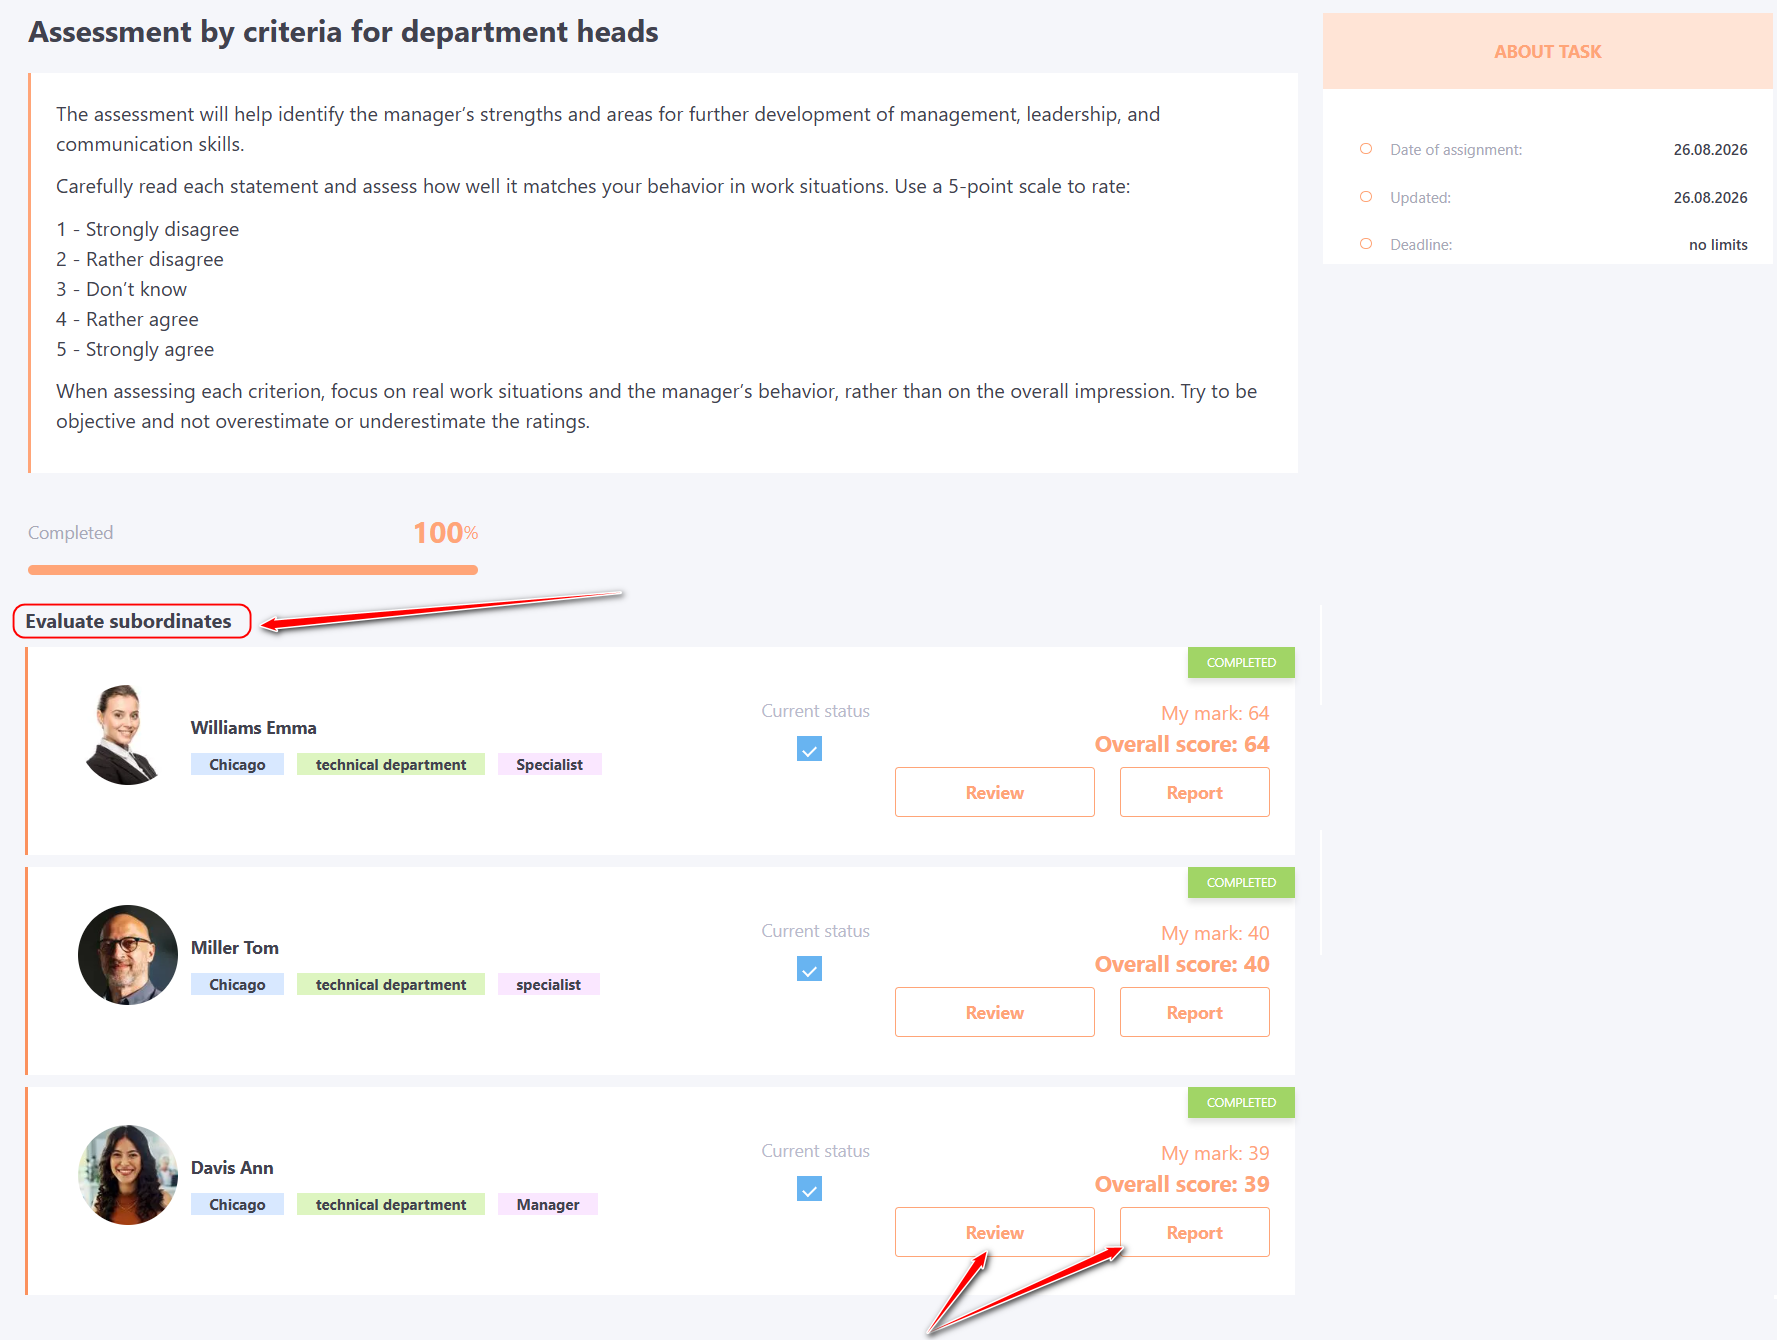
If the "Allow the manager to review the results by subordinates" option is enabled in the Settings Block when creating an assessment task, then the user assigned to the assessment as a manager will be able to view the Report on the results of the subordinates' assessment from the assigned tasks page.
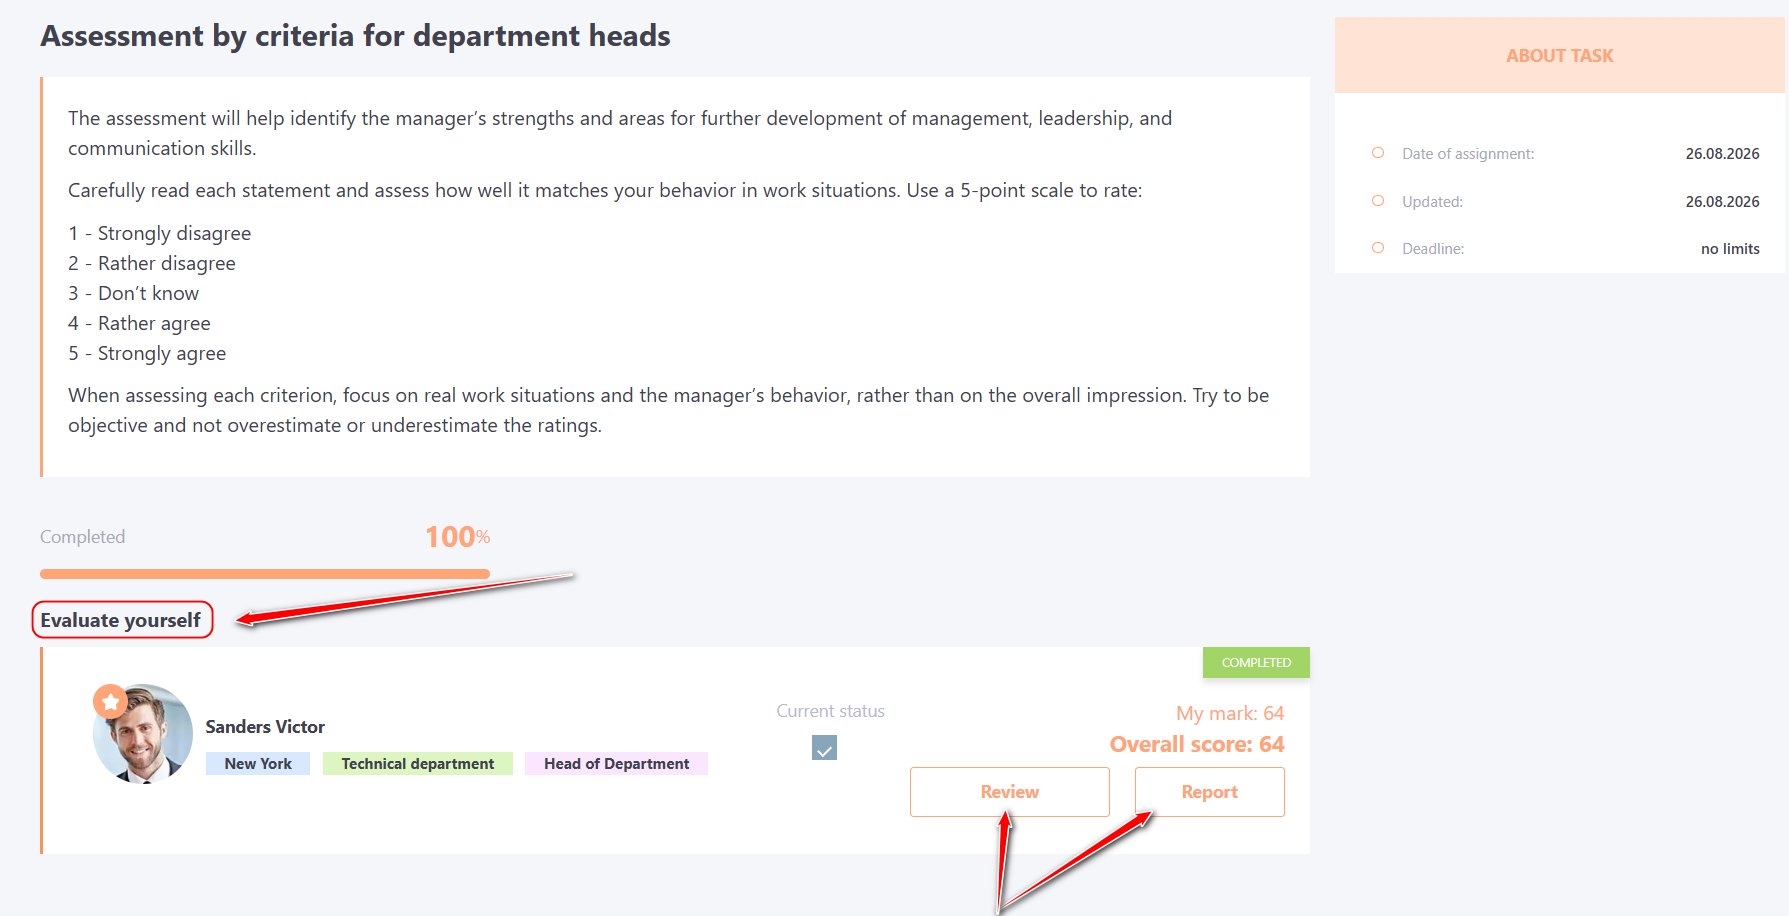
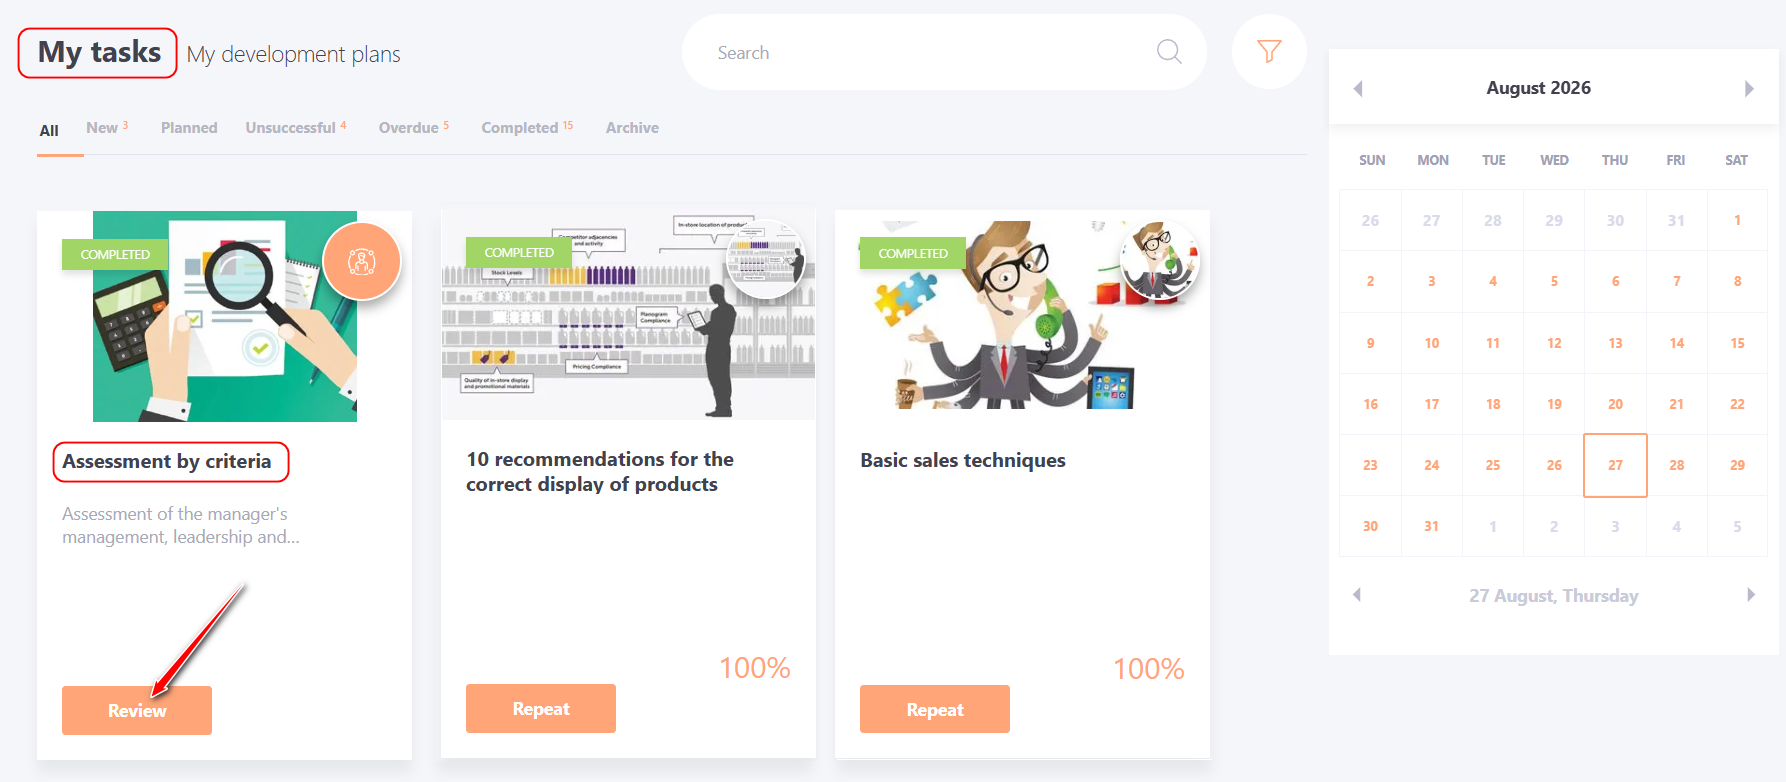
To view the Report, go to the Learning - My Tasks menu and click the Review button on the card of the corresponding assessment task.
After the manager completes the evaluation of subordinates, the following actions will be available in the Evaluate subordinates block opposite each employee:
- Review — view the answers provided by the manager during the evaluation of this employee;
- Report — go to the Report Contents page, where a detailed analysis of the evaluation results of the selected employee is available.
User viewing of assessment by criteria report
If the "Allow the survey participant to see own received mark" option is enabled in the Settings Block when creating an assessment task, then after completing the self-assessment, the user will be able to view the Assessment Results Report from the assigned tasks page.
To view the Report, go to the Learning - My Tasks menu and click the Review button on the card of the corresponding assessment task.
After completing the self-assessment, the following actions become available to the user:
- Review - view the answers provided by the user during the self-assessment;
- Report - go to the Report Contents page, where a detailed analysis of the assessment results is available.