Programs report
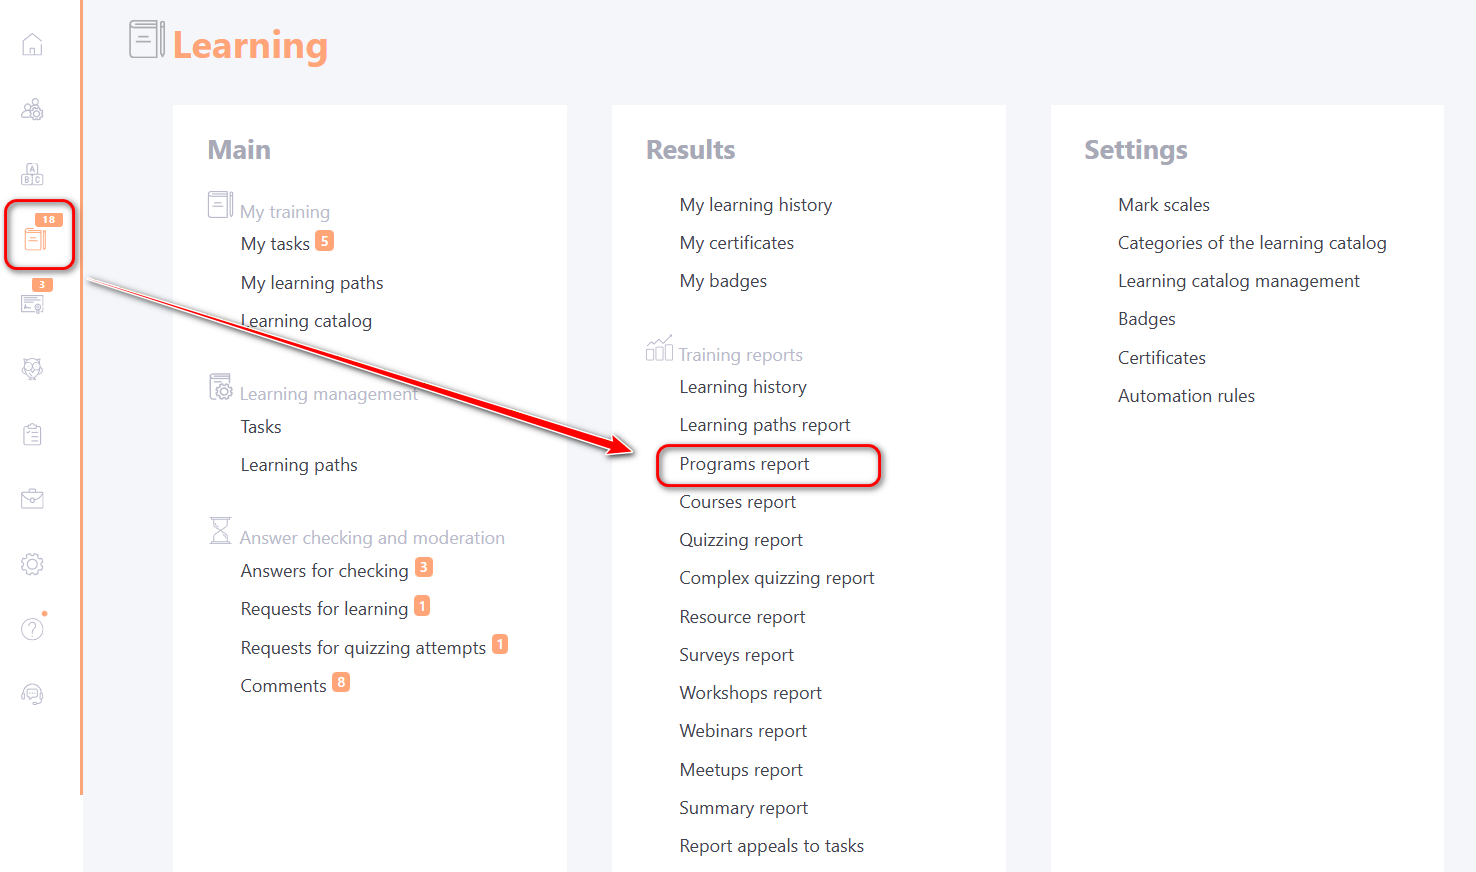
To view reports on training programs, go to Learning - Training reports - Programs report.
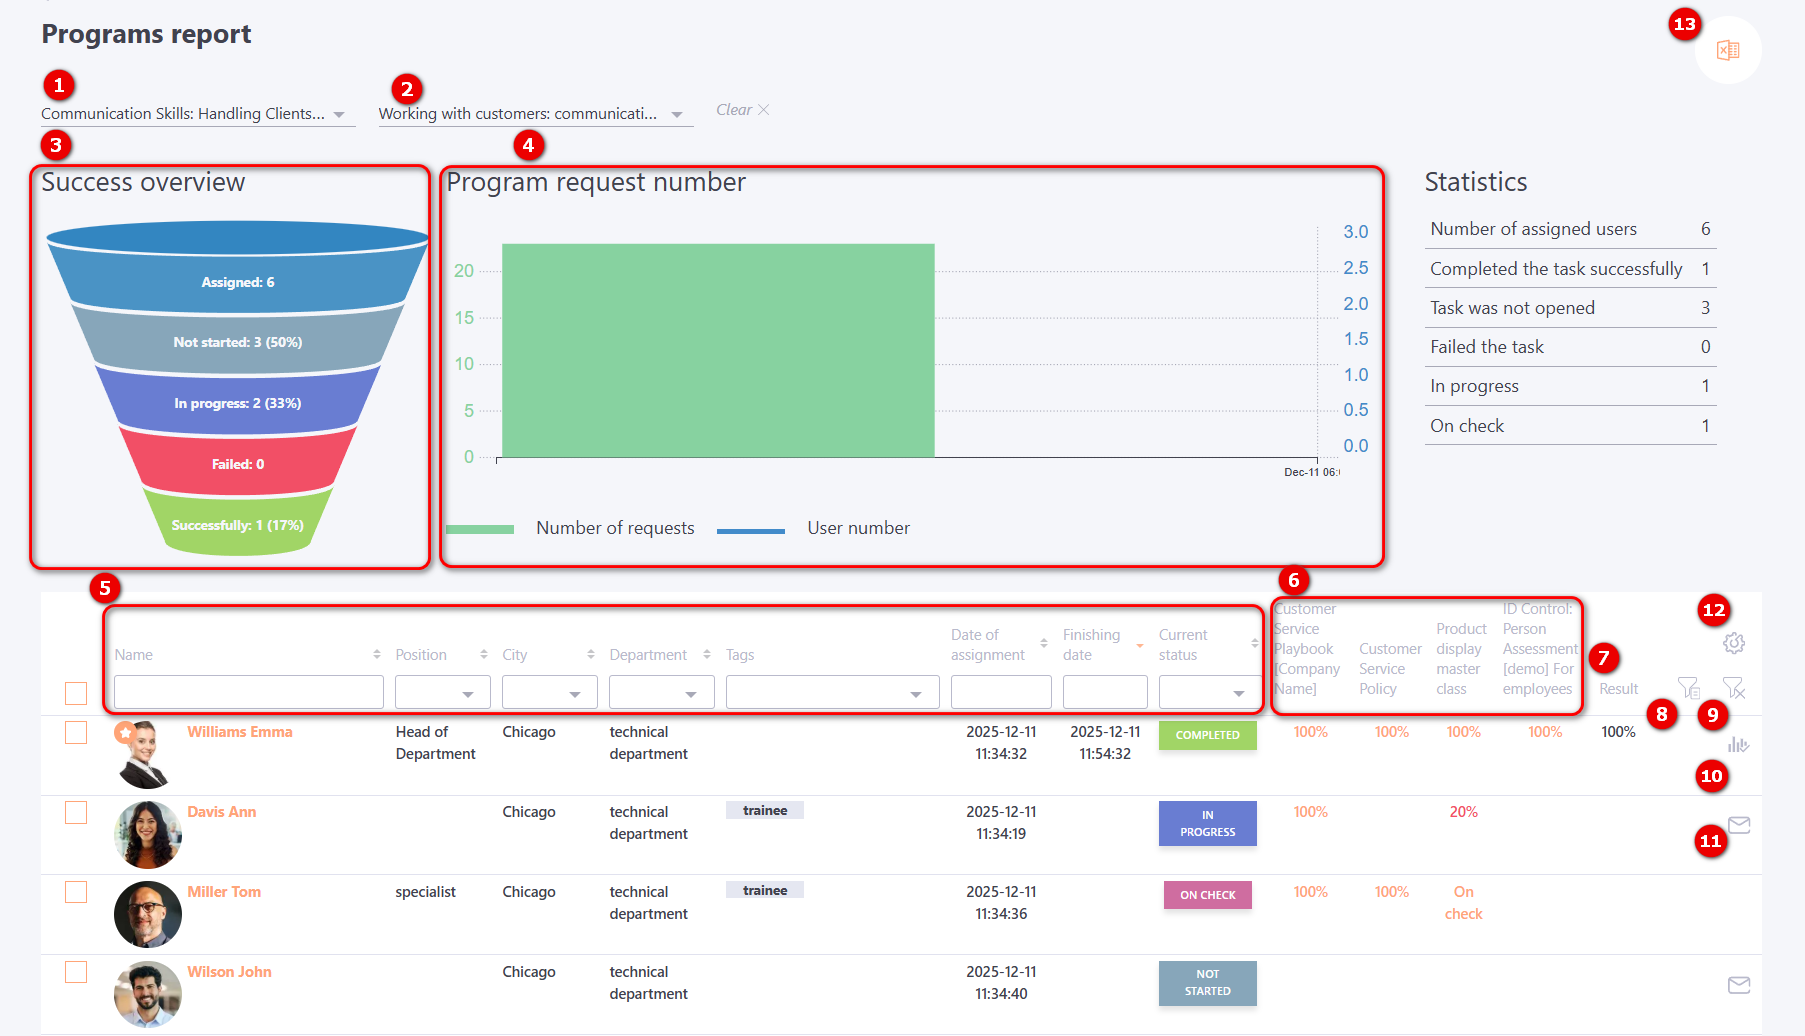
To generate a report, the following filters should be used:
- (1) – a list of program names for which tasks have been created;
- (2) – selection of tasks that used the chosen program. This filter becomes available after selecting a program in the first filter. The task name, creation date, and ID are displayed. By default, "All tasks" is selected.
For Programs report, information is also displayed using charts:
-
(3) - The Success overview generated based on the completion statuses of the program by users:
- Successfully - the number of all users who have successfully passed the Program (the status of the task for such users is "Completed");
- Failed - the number of all users who have not successfully passed the Program (the status of completion of tasks is "Failed");
- In progress - number of users who have started Program (status of tasks - "In progress");
- Not started -the number of users who did not open the task;
- Assigned – number of users assigned to the task.
-
(4) - Program request number chart - the chart shows how and when users were went through the program. The graph is built from the first access to the program. To get information for another period, you should set filters in the table with users. The chart reacts to all changes in the filters. The graph displays two types of data:
- Number of requests - bar charts showing the number of times the program was opened;
- User number - a line graph indicating the number of users who passed the program on separate dates.
In addition, the report displays the following information:
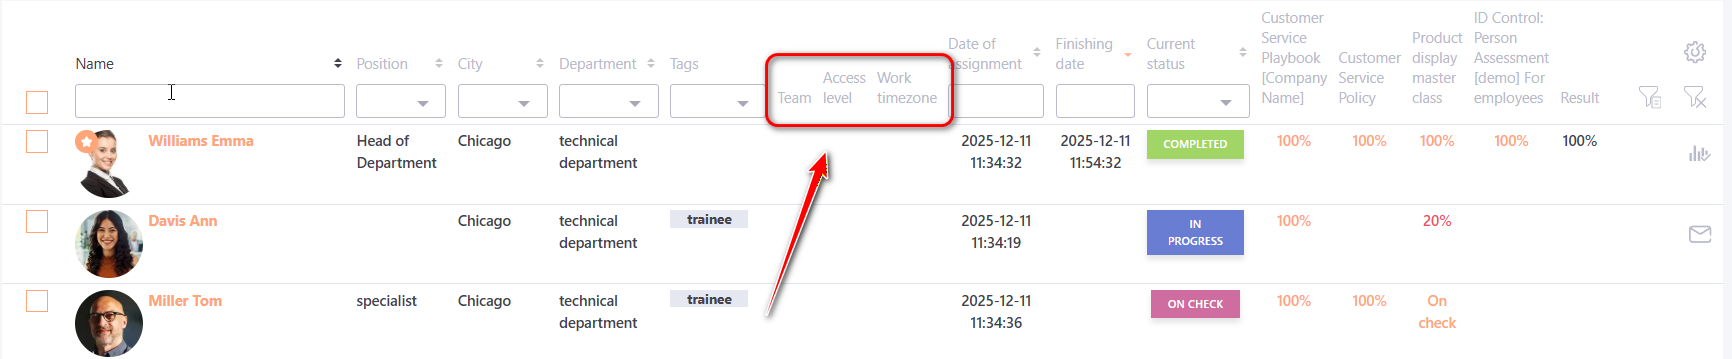
User data (5): Name, Position, City, Department, Tags, Date of assignment, Finishing date, Current Status – all fields are available for filtering and sorting.
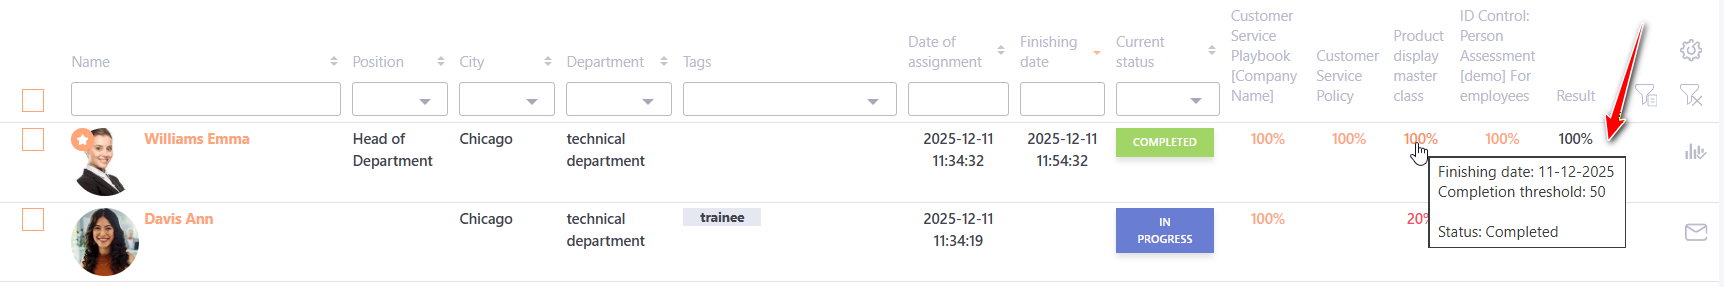
For all elements of the program a tooltip appears when you hover your cursor over the result.
The tooltip displays:
- Resource title;
- The date of completion of the item;
- Passing threshold (at the moment of passing the element);
- Completion status.
Additionally, for each task of the Program, the completion result is displayed as a percentage. The score for each Program element is clickable and leads to a detailed report showing the completion of that element by an individual user.
The Result column (7) shows the overall Program completion result.
If the “Fix the result of the task” checkbox is enabled, the result does not update automatically. More details: Course settings page in the program.
When viewing the Program report, a filter by Organizational structure (8) is also available.
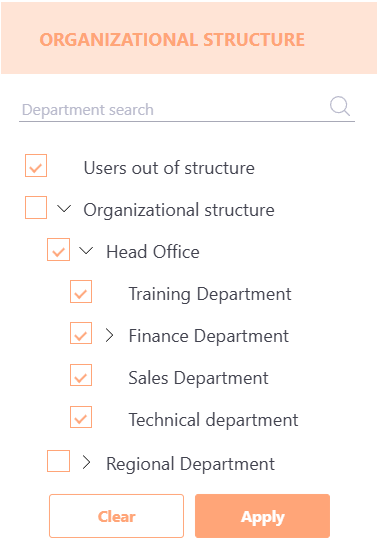
The filter displays users in the table based on the selected organizational structure folders.
At the top of the list, there is a "Users out of structure" checkbox, which allows filtering users who do not belong to any organizational structure folder.
Below, a hierarchical list of all organizational structure folders is displayed, preserving the levels of nesting.
All filters can be reset using the Reset Filter (9) button.
The Protocol of changes in the status of tasks (10) button allows viewing the changes in task statuses for an individual user.
Using the Send a reminder (11) button, it is possible to send notifications to users about the need to complete the Program.
Using the Table customization (12) button, you can configure the display of columns in the report, including additional user fields:
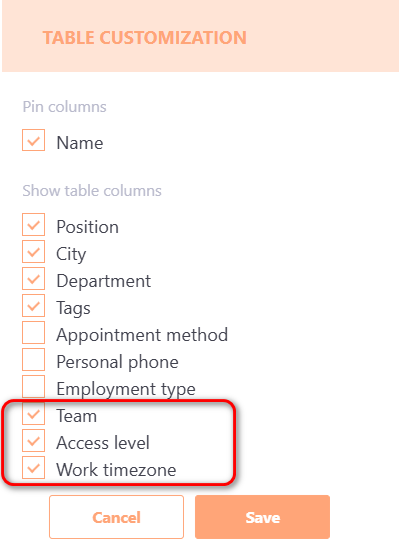
After saving the settings, all selected columns will be displayed in the report. If the "Pin columns" option is selected, the chosen columns will be fixed, and the report can be scrolled horizontally using the scrollbar.
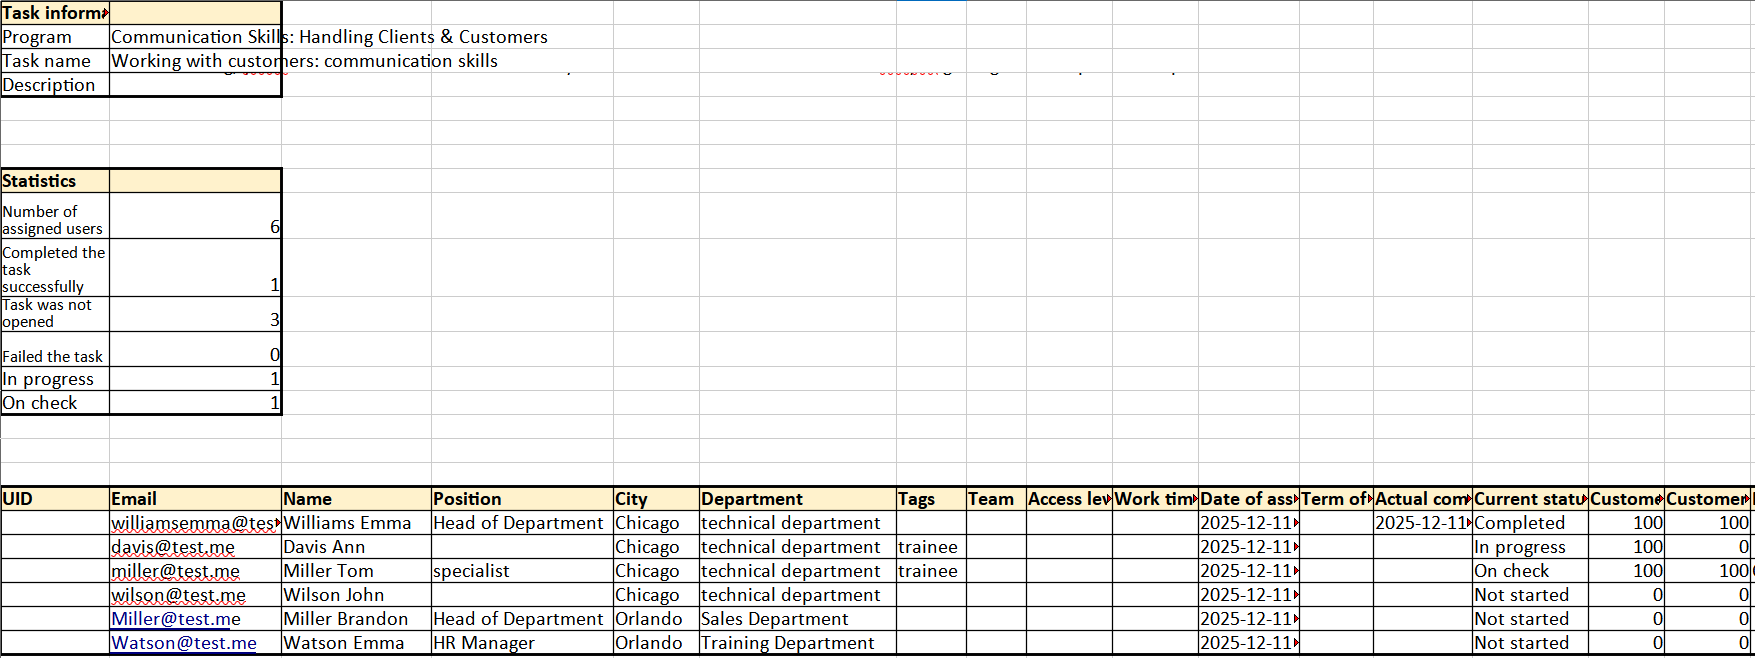
Using the Export to Excel (13) button, the report can be exported as an xls file.