Quizzing report
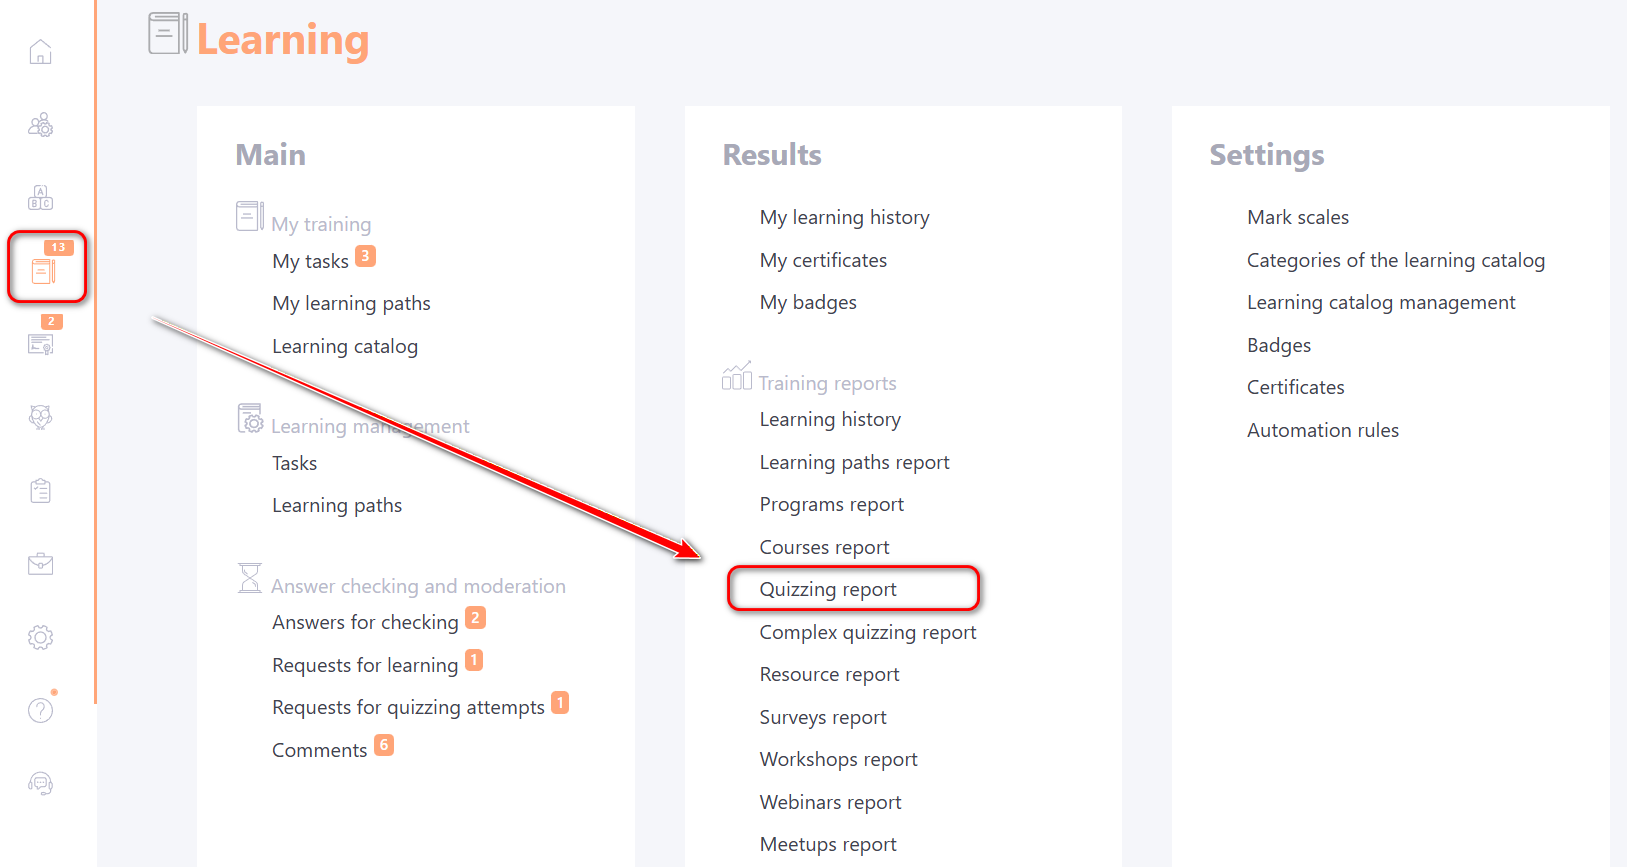
To view quiz reports, select the Learning - Training reports - Quizzing reports menu:
Quizzes can be used as separate tasks, can be part of the learning program or course plan.
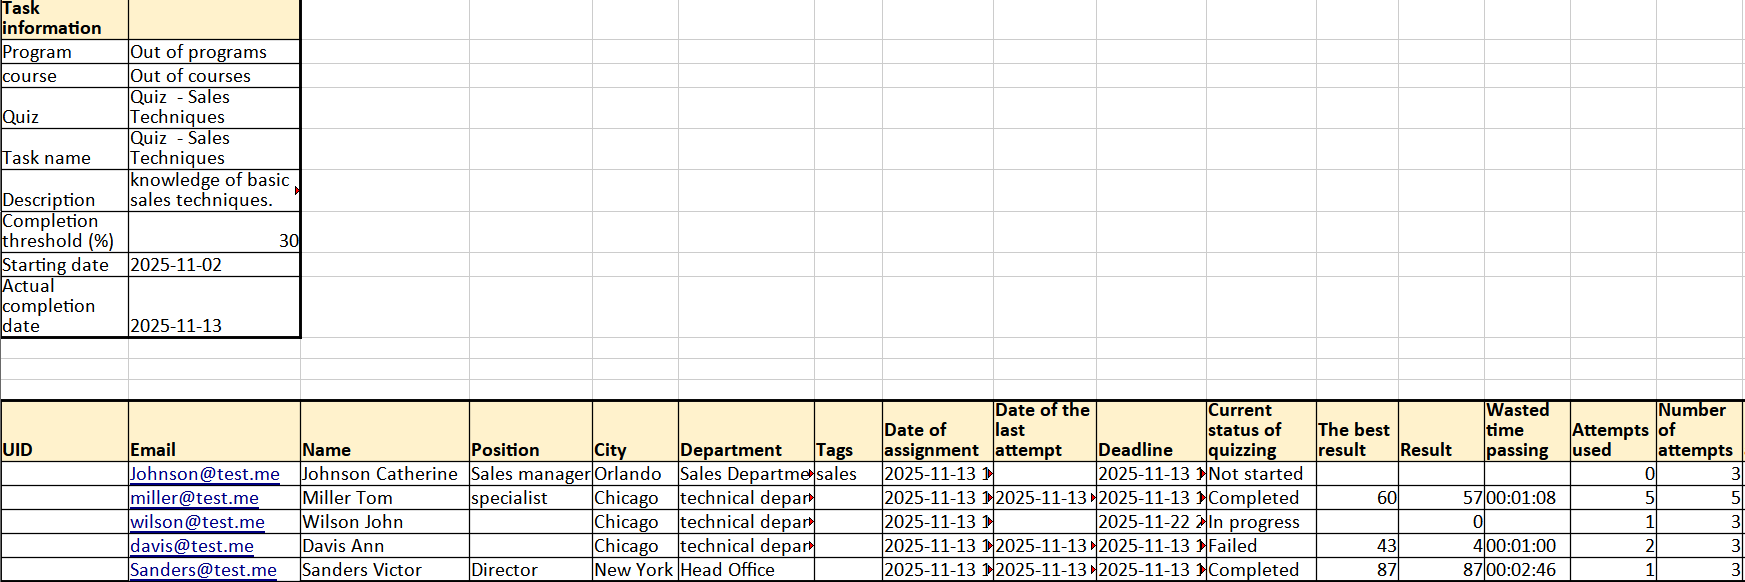
The following filters are used to select the required task:
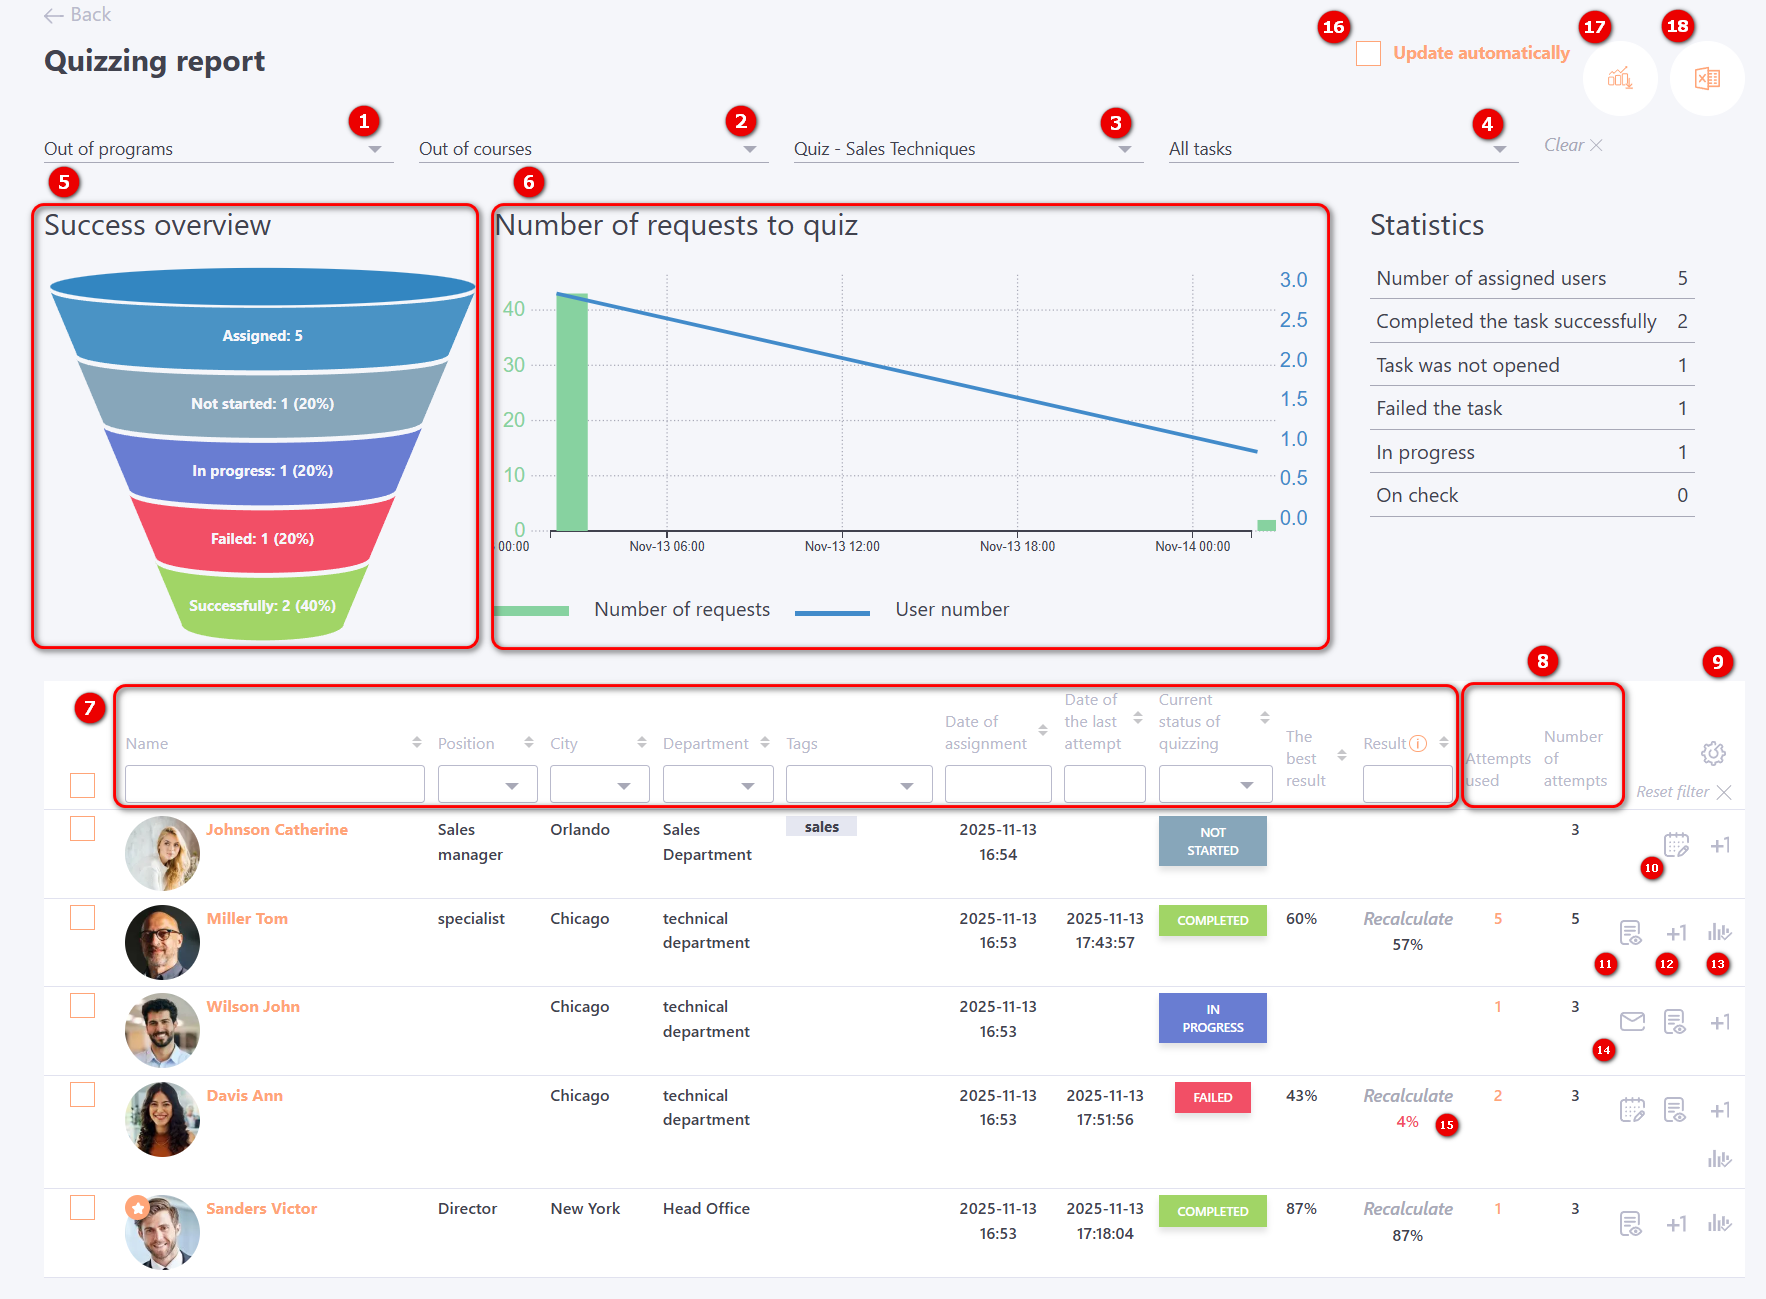
- (1) - to select programs that include quizzes. Only programs with quizzes within them that are used in tasks are displayed. By default, the value " Out of programs" is selected
- (2) - filter to select courses where quizzes are used. Only for courses with which the task is created;
- (3) - filter for selecting quizzes used in separate tasks;
- (4) - selection of the task title. Next to the title, its Id number is displayed.
For quiz reports, information is also displayed using charts:
- (5) - Success overview chart
- (6) - Number of requests to quiz chart
The Success overview chart is built on the status of quiz completion by users:
- Successfully - the number of all users who have successfully passed the quiz (the status of the task for such users is "Completed");
- Failed - the number of all users who have not successfully passed the test (the status of completion of tasks is "Failed");
- In progress - кnumber of users who have started quizzing (status of tasks - "In progress");
- Not started -the number of users who did not open the task;
- Assigned – number of users assigned to the task.
Number of requests to quiz chart - the chart shows how and when users were quizzed. The graph is built from the first access to the quiz. To get information for another period, you should set filters in the table with users. The chart reacts to all changes in the filters. The graph displays two types of data:
- Number of requests - bar charts showing the number of times the quiz was opened (must correspond to the data in Report appeals to tasks);
- User number - a line graph indicating the number of users who passed the quiz on separate dates.
In addition, the report displays the following information:
(7) — fields for filtering and sorting the table by the following data: User’s Full Name, Position, City, Department, Tags, Assignment Date, Date of the Last Test Attempt, Current Test Status, Best Result (from all attempts), and Result (depending on the task settings: last attempt or best of all attempts).
Example rules that can be used for filtering by the Result field:
- 10 — everything that equals 10;
- = 10 — everything that is greater than or equal to 10;
- <= 10 — everything that is less than or equal to 10;
- 10–100 — everything from 10 to 100 inclusive.
(8) — Attempts Used and Number of Attempts;
(9) — Table customization;
(10) - Extend deadline — displayed for users whose task status is “not started” or “failed” and whose completion deadline has expired. More details:Extend the task completion time for specific users.
(11) - Read more — opens the Protocol of answers for each question from the attempt used to determine the final result, whether it is the best attempt or the most recent one.
(12) - Add attempt (if the number of attempts was limited);
(13) - Protocol of changes in the status of tasks - opens the status change log for this user for the given task (details: Protocol of changes in the status of tasks);
(14) - Send a reminder to the user about an uncompleted task. The notification is sent using the Reminder about an uncompleted task for sending manually template (find more in Notification templates for Tasks)
(15) - Recalculate - in certain cases, the test result can be recalculated: for example, when the set of questions, the passing threshold, or other test parameters have changed. In such cases, a Recalculate button will be available in the Result column. The result will be recalculated according to the new parameters without requiring the user to retake the test. More details: Result recalculation
(16) - Update automatically - the data on the page will be displayed in real time. That is, they are updated automatically.
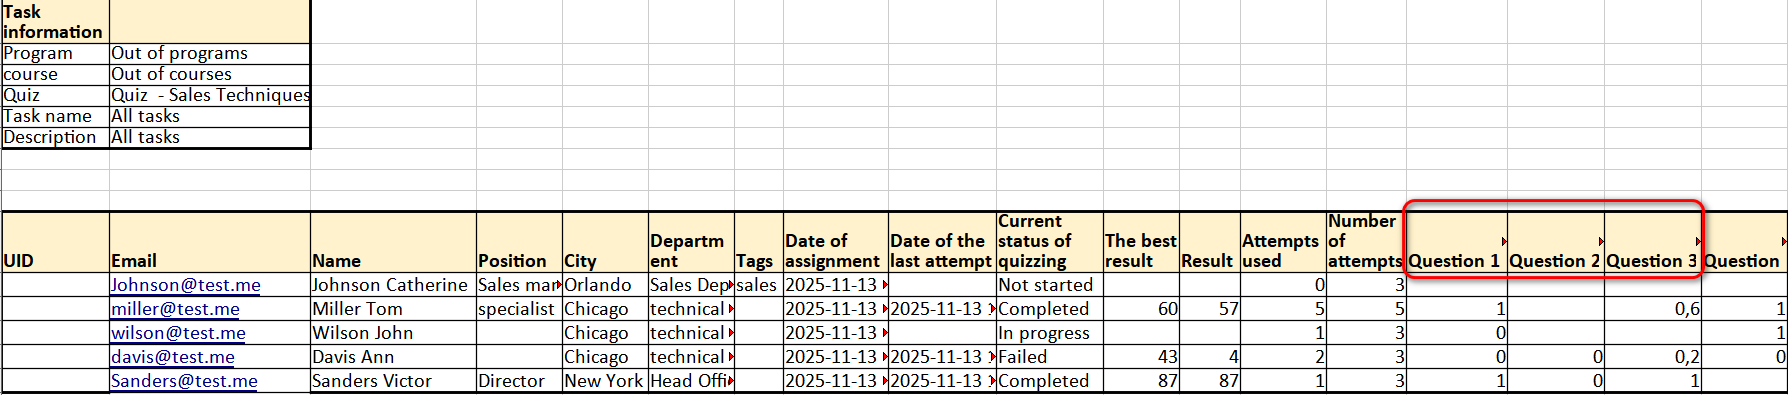
(17) - Detailed report in Excel - (includes data on each question from the attempt, which determines the performance result - the best of all or the last);
(18) - Export to Excel
Number of testing attempts
Users can take a task either a limited or unlimited number of times (set in the task settings). This number is displayed as a numeric value in the Number of Attempts field, or as the infinity symbol ∞ if attempts are unlimited.
Information about all testing attempts is stored in reports. In the main table, it is shown as a number in the Attempts Used field. Clicking on this number opens the Quizzing attempts page, which provides details for each attempt:
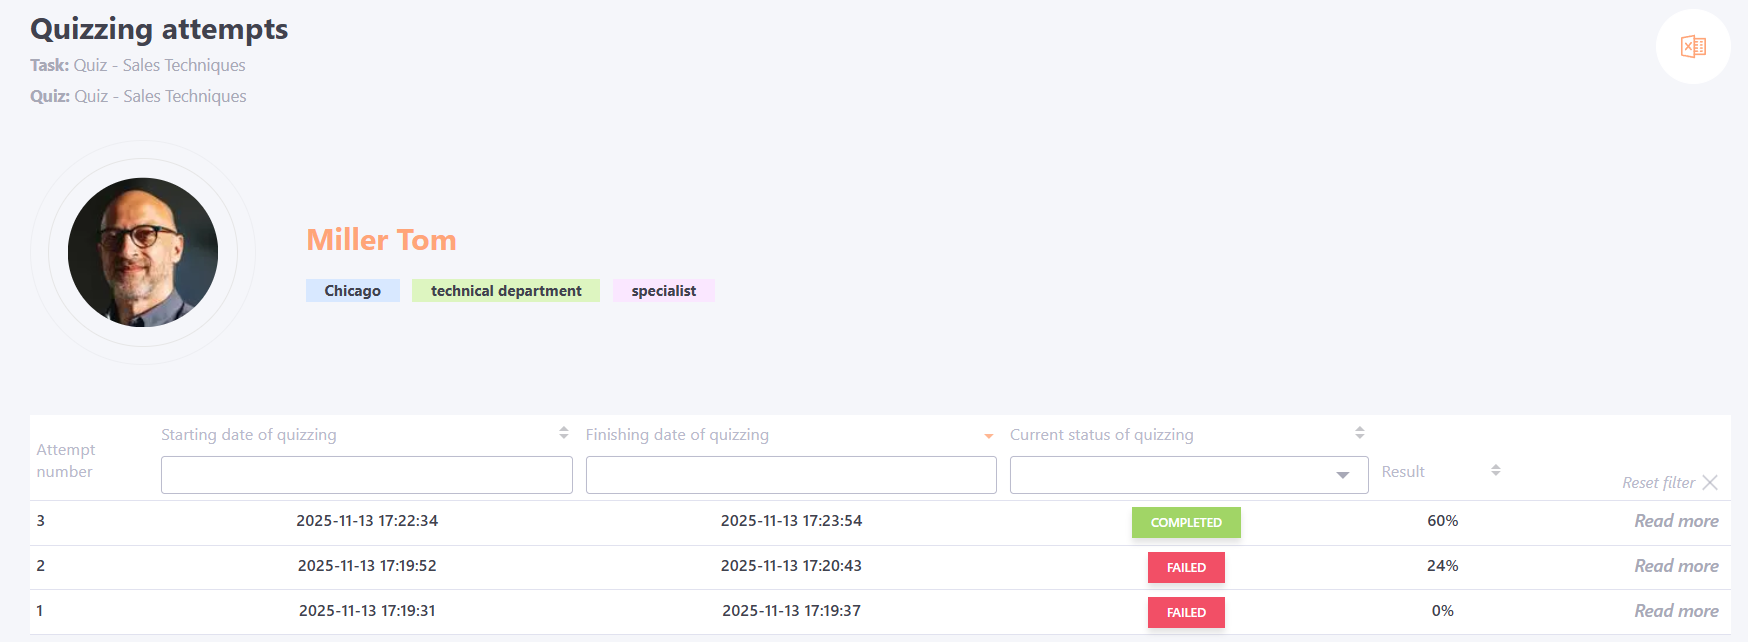
From this page, you can navigate to the Protocol of answers for each test attempt.
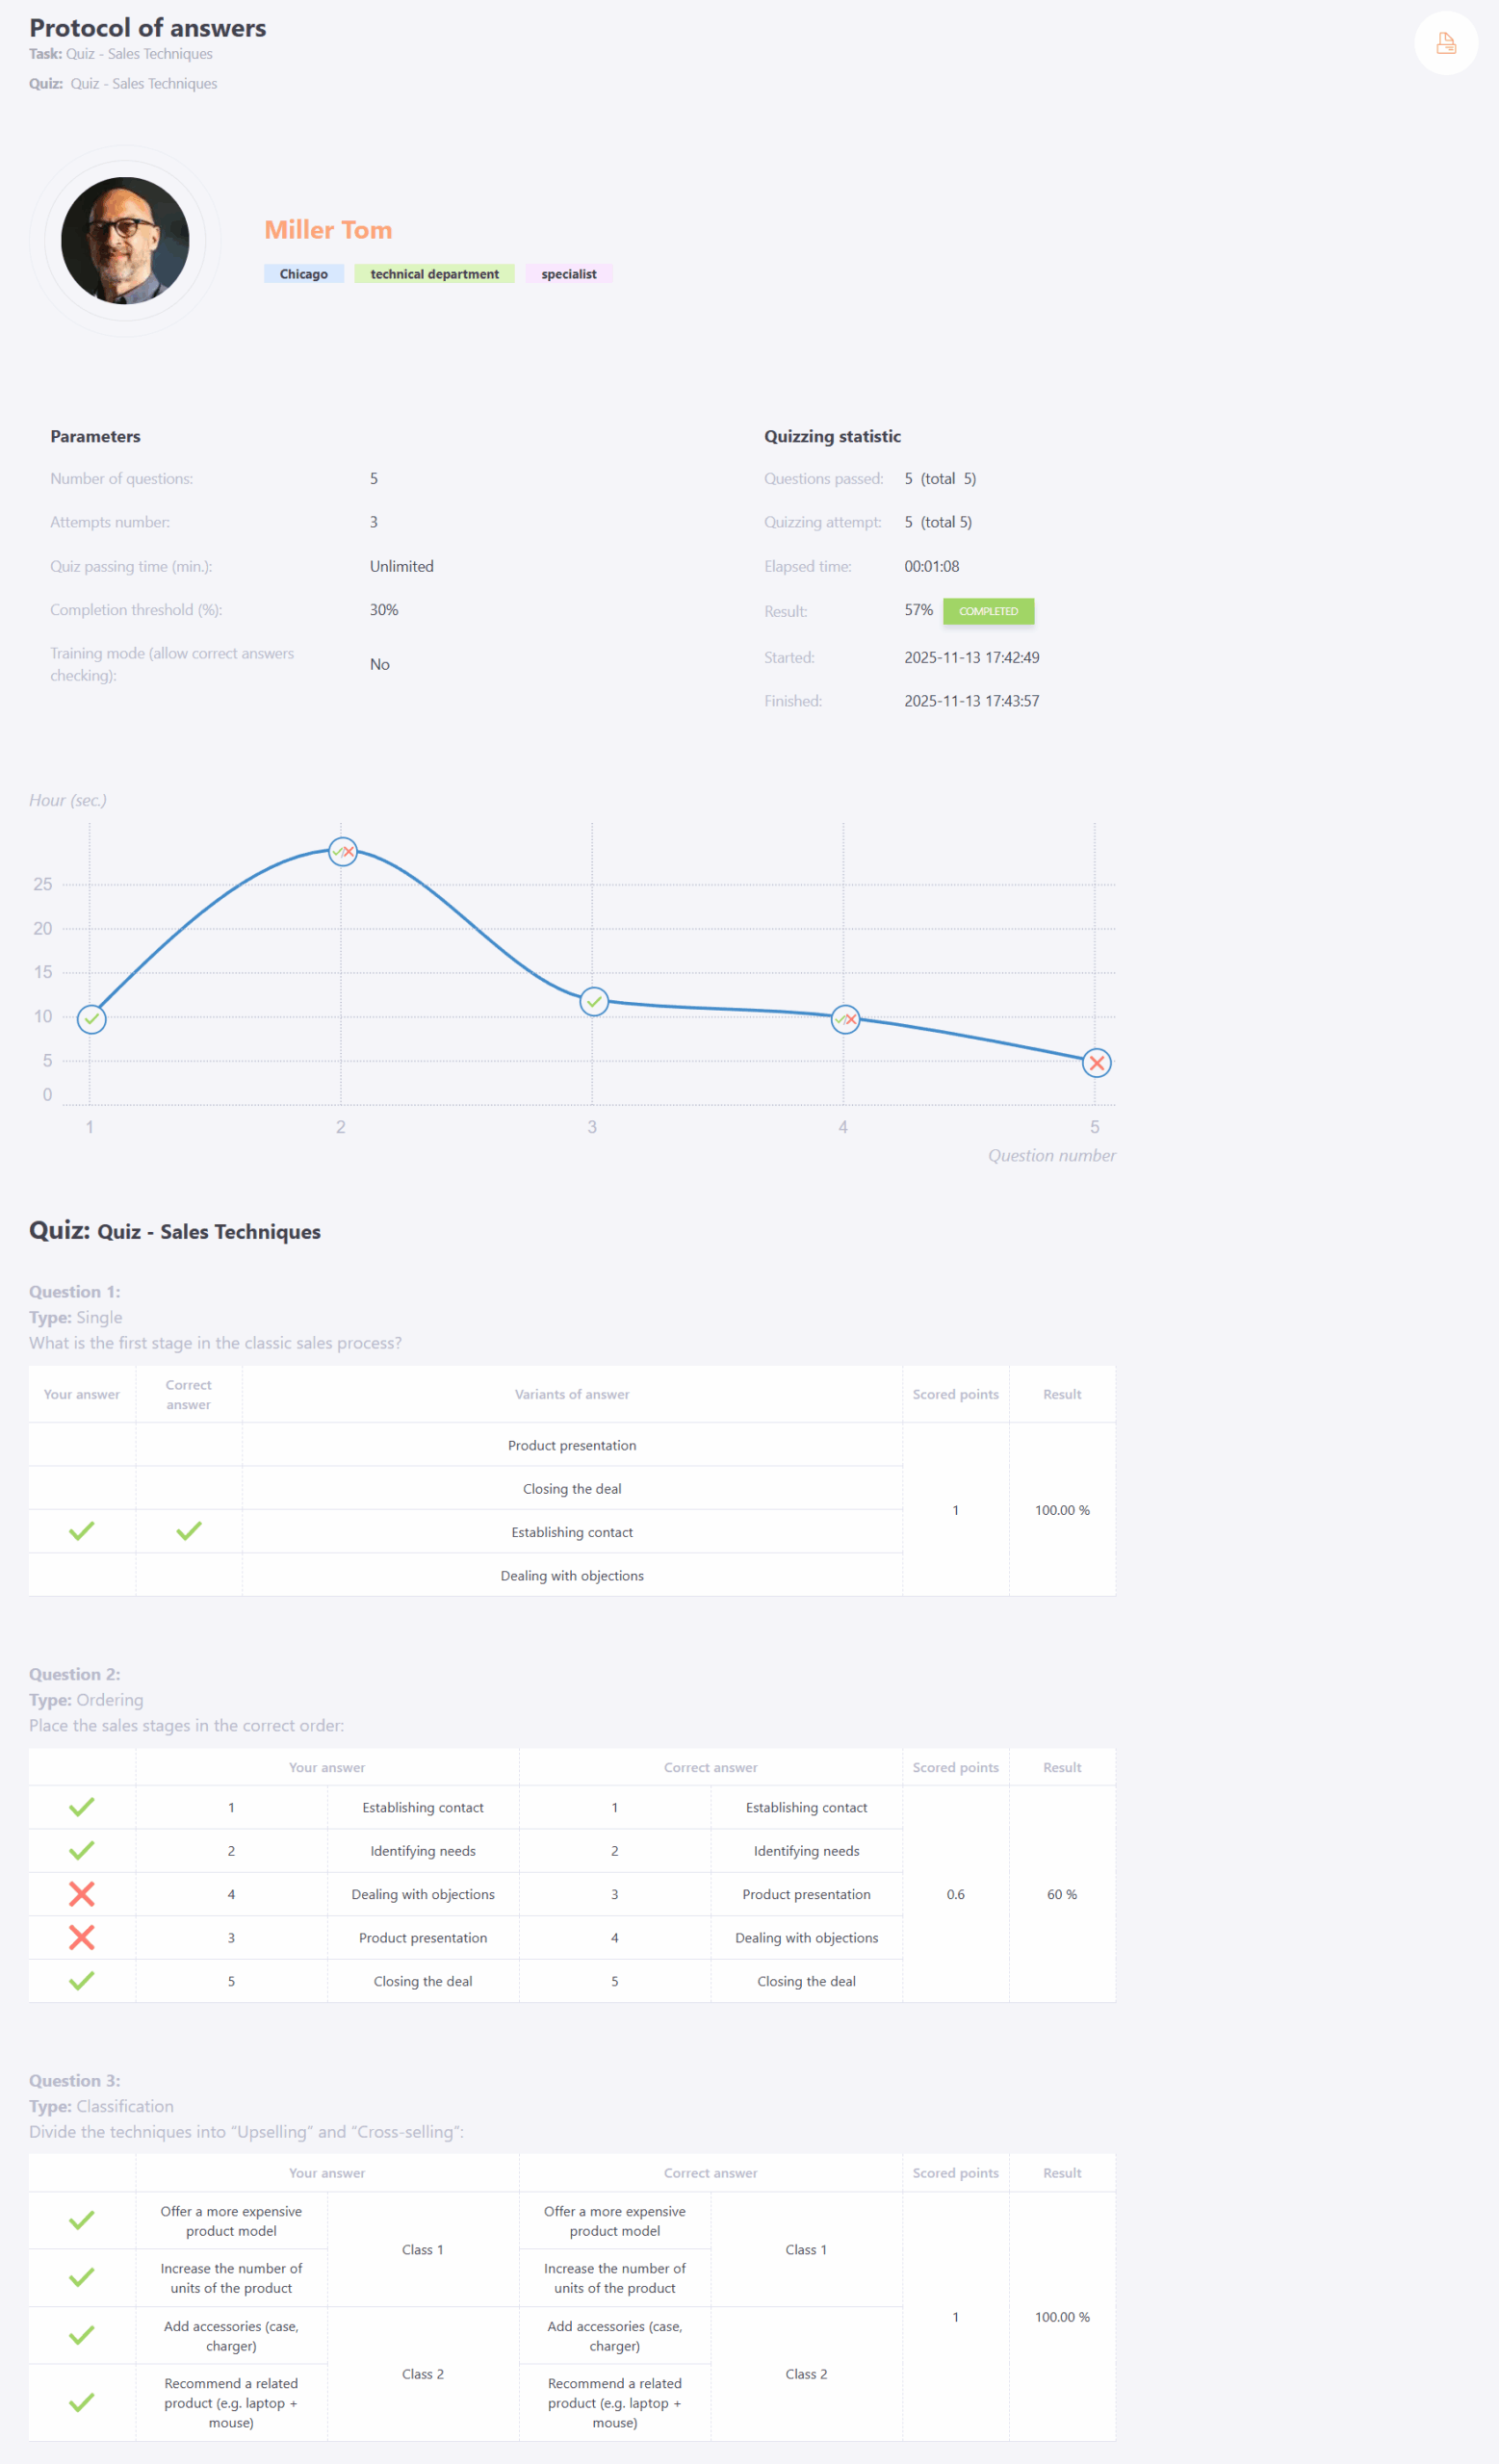
Protocol of answers
The Protocol of answers page displays information about the quiz parameters, user quiz statistics, a chart of the user’s answers based on the time spent on each question, and details of the answers for each question.
Example of how the result is displayed in the Protocol of answers for a multiple question with the Scoring Method – By Formula.
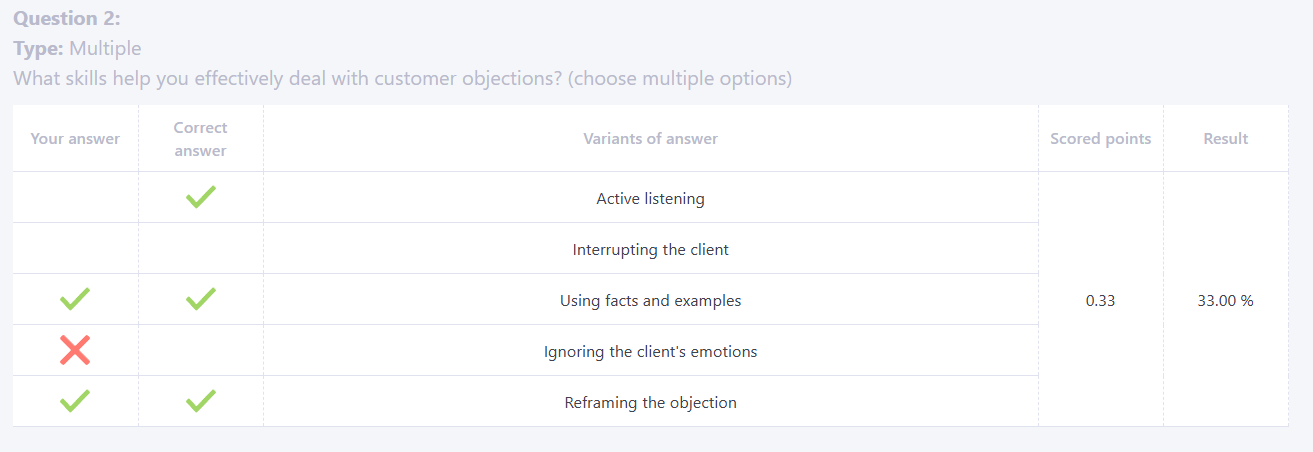
Example of how the result is displayed in the Protocol of answers for a multiple question with the Scoring Method – All or Nothing.
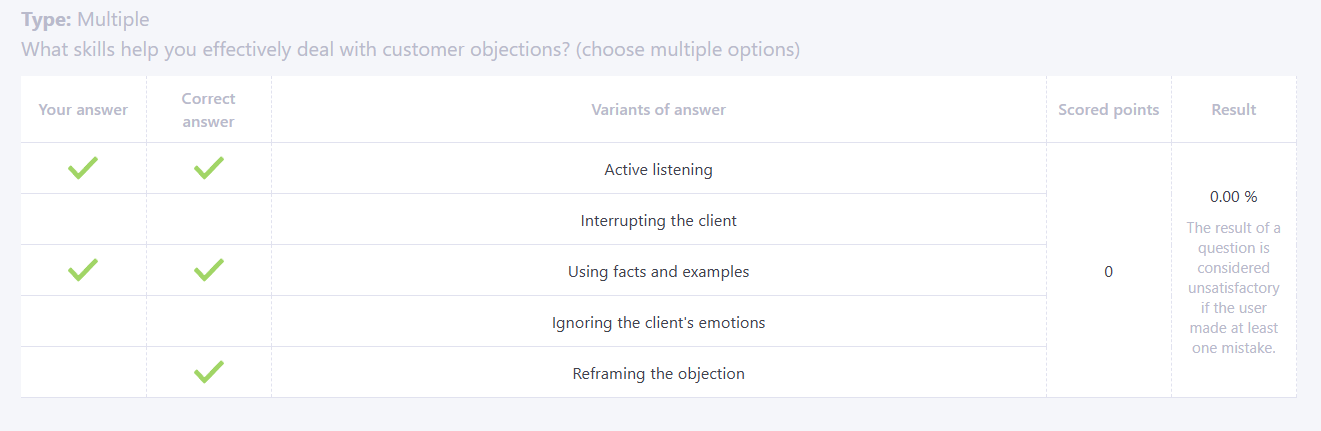
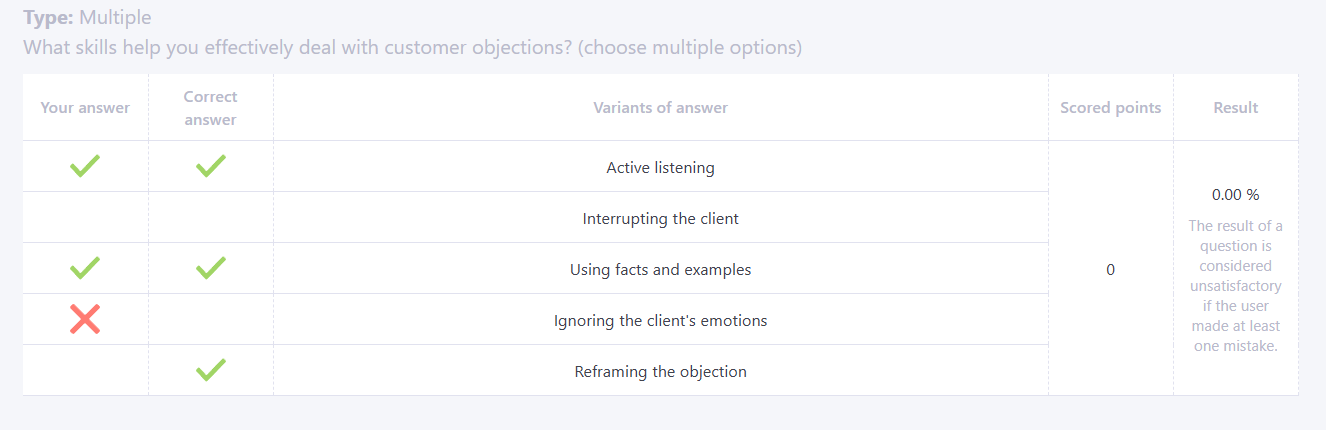
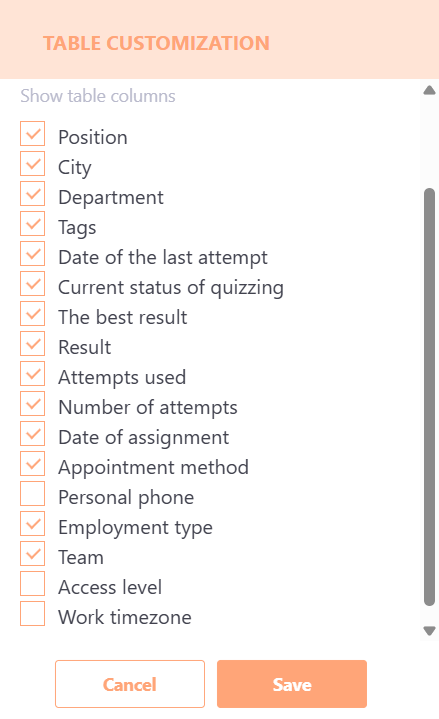
Table customization
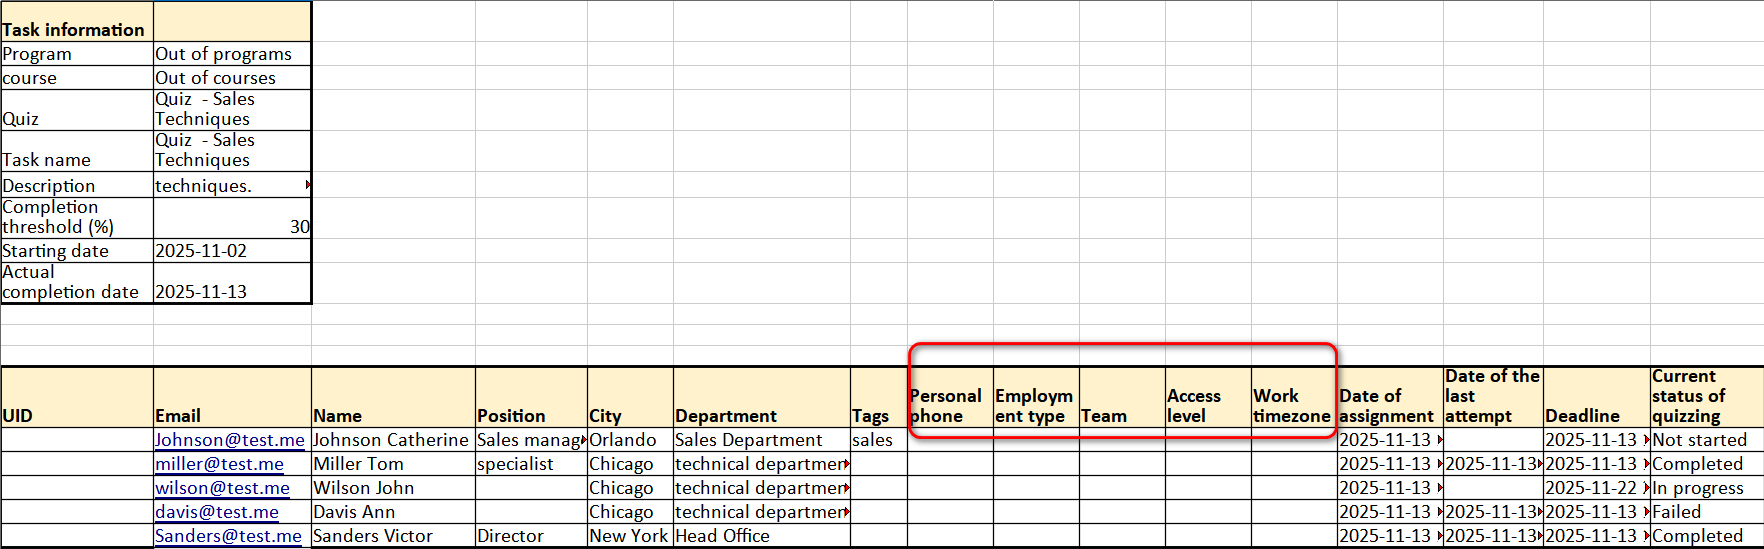
By clicking the table settings button  (9), you can customize the display of columns in the report, including additional user fields:
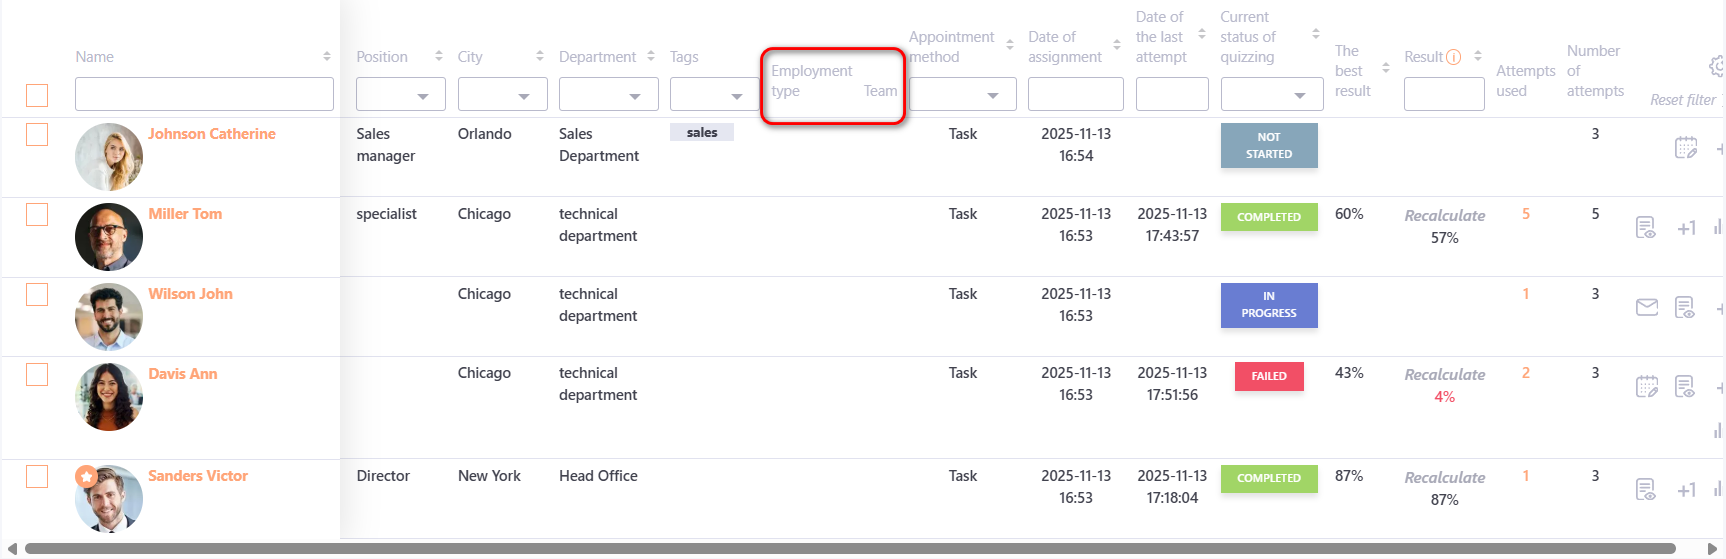
After saving the settings, all selected columns will be displayed in the report. If the Pin Columns option is selected, the chosen columns will be pinned, and the report can be scrolled horizontally using a slider:
These column settings also affect the Excel report; the selected columns will be displayed there as well